Slide 1 of 34
GameStop (NYSE: GME): the card shop Wall Street refuses to look at
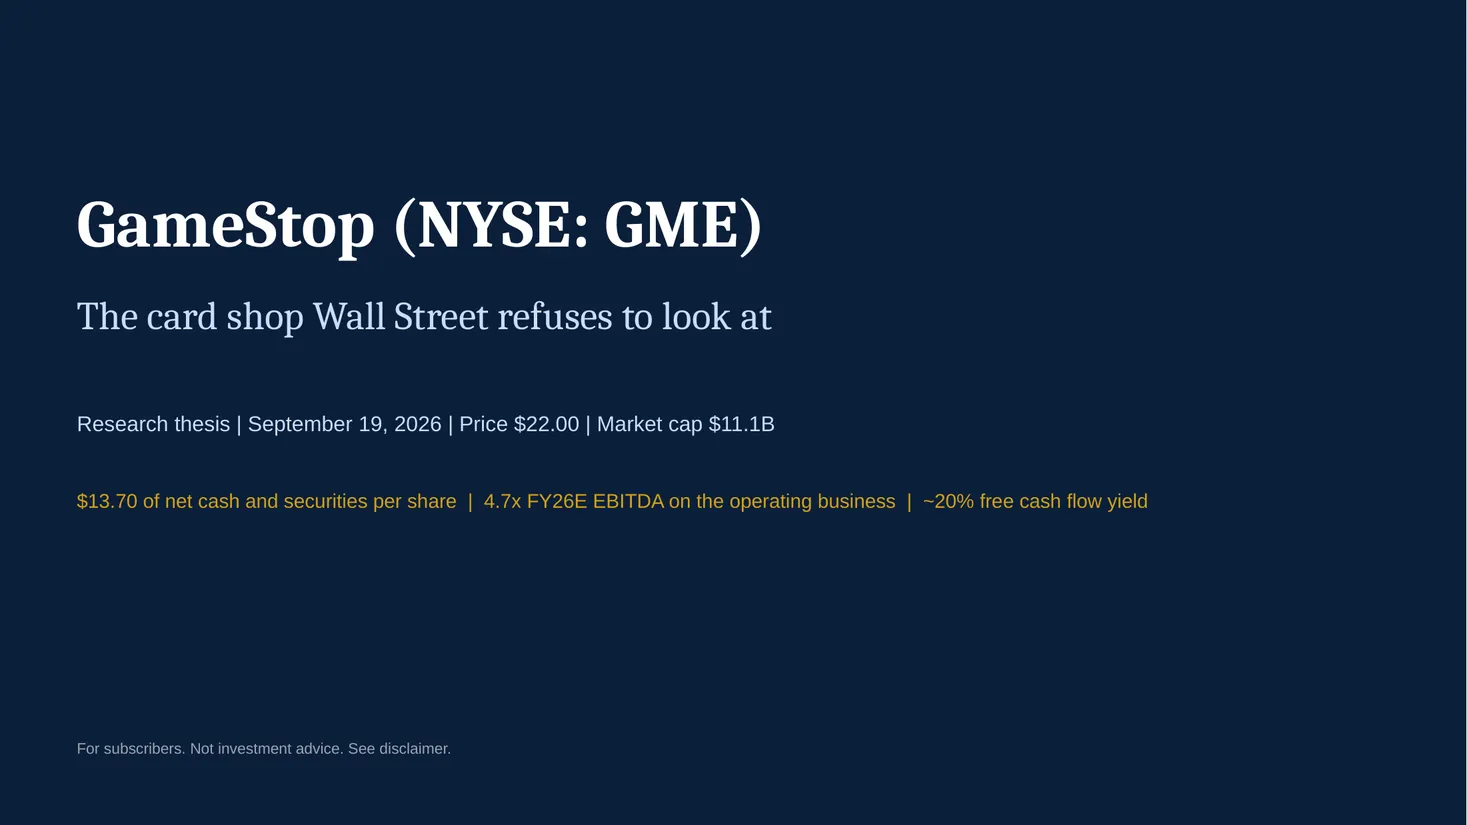
The card shop Wall Street refuses to look at
Research thesis | September 19, 2026 | Price $22.00 | Market cap $11.1B
$13.70 of net cash and securities per share | 4.7x FY26E EBITDA on the operating business | ~20% free cash flow yield
For subscribers. Not investment advice. See disclaimer.
Slide 2 of 34
Disclaimer
This presentation expresses our research opinions and is provided for informational purposes only. You should assume that as of the publication date the author and/or subscribers may hold long positions in the securities discussed, including GameStop Corp. (GME), and may transact in them at any time without notice. All information is drawn from public sources believed to be reliable (SEC filings, company releases, industry data providers, press) and from our own channel checks; we make no representation as to its accuracy or completeness. Estimates, forecasts and pro forma analyses are illustrative, depend on assumptions that may prove wrong, and are identified as estimates where the company does not disclose the underlying figure (category margins, PSA submission volumes, Pokémon's share of sales, per-store costs). Fiscal years end in late January/early February (FY2025 = year ended January 31, 2026). The author holds a long position in GME and may buy or sell at any time after publication without notice. The Value Road and deepfuckingvalue.com are not affiliated with, endorsed by or connected to Keith Gill, Roaring Kitty or GameStop Corp. This is not investment, legal or tax advice and is not an offer to buy or sell any security. Do your own work.
Slide 3 of 34
About The Value Road
Published by The Value Road | thevalueroad.substack.com | @leevalueroach on X
What we look for
Deep value. Margin of safety. No permission required.
Hated, ignored or misunderstood companies where the price already assumes the worst, the balance sheet gives you time to be right, and the business is quietly better than the narrative. The best ideas have no analyst coverage and a stigma that keeps institutions away.
The Value Road is written by a self-taught deep value investor who does not buy anything without a margin of safety and does not care what Wall Street thinks of it. The research is long-form and fundamental: filings, unit economics, channel checks, primary data, and a model built from scratch rather than borrowed from a broker.
Why it works
Wall Street is a consensus machine: the same models, the same conferences, the same career risk. Sell-side estimates cluster, 13F holdings cluster, and almost no one is paid to be early on a name that is embarrassing to own. Deep fundamental work on deeply out-of-favor, undervalued companies is one of the few edges that has not been arbitraged away, because most of the street is structurally unable to use it.
How we work
thevalueroad.substack.com
x.com/leevalueroach
Read every filing. Rebuild the financials. Visit the stores. Pull the primary data ourselves. Size the downside before the upside. Write it up so a reader can check every number. Own the position we write about.
Slide 4 of 34
Contents
1 Executive summary
2 The setup: capital structure and what you pay for the business
3 Earnings: sandbagged guide, the bridge to $885M, operating leverage, cash conversion
4 The business: mix shift, four-wall economics, store count, the trade-in engine
5 The category: eBay demand data, PSA grading, the 30th anniversary, 400 years of collectibles, macro
6 The people: insider buying, Cohen's alignment, the cost-cutting record
7 Optionality: eBay, Whatnot, the PSA network
8 Valuation: comps, forecast, catalysts
9 Risks: what would make us wrong
Slide 5 of 34
Executive summary: what you actually get for $22
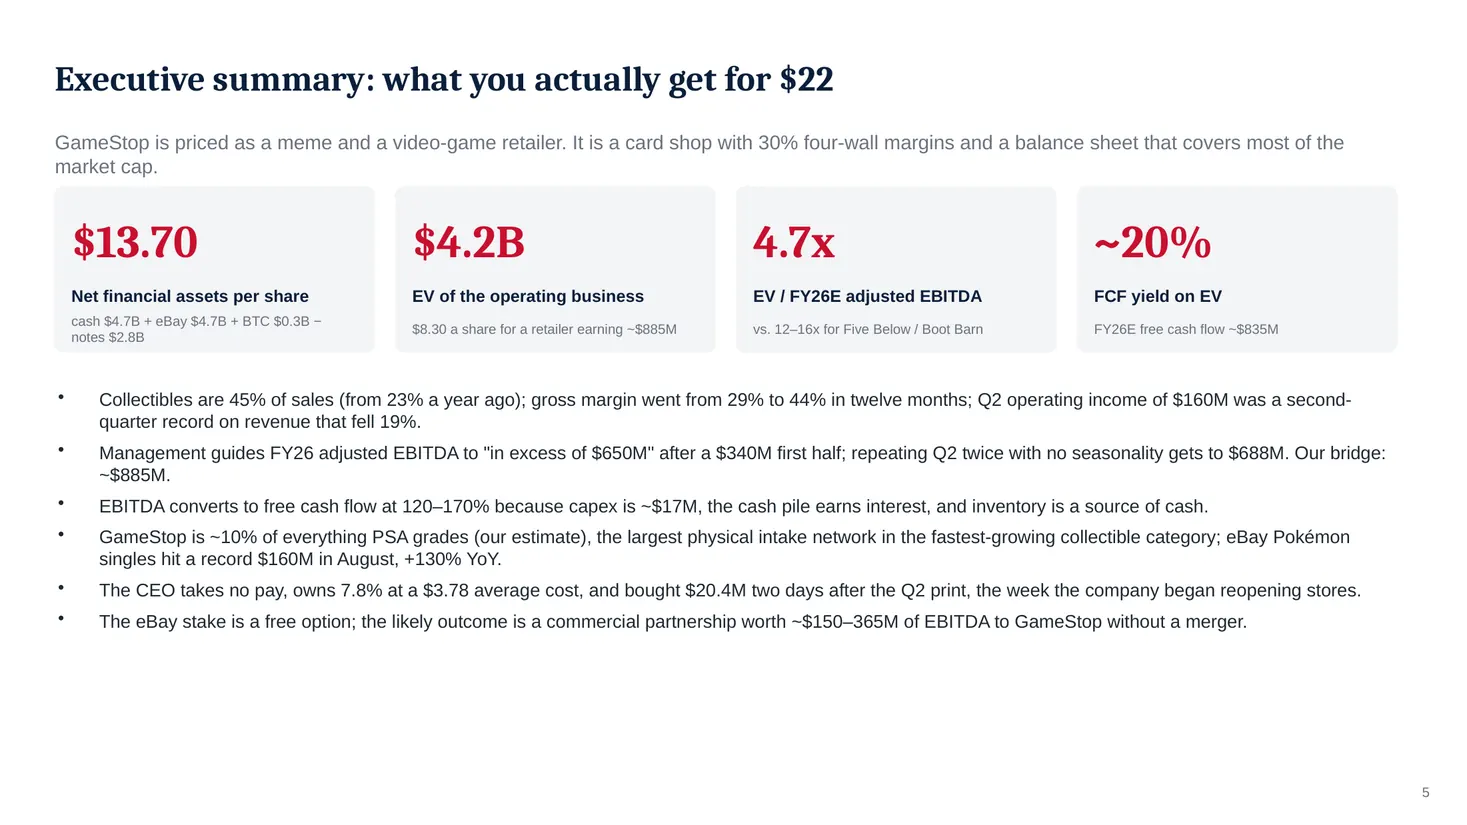
GameStop is priced as a meme and a video-game retailer. It is a card shop with 30% four-wall margins and a balance sheet that covers most of the market cap.
$13.70
$4.2B
4.7x
~20%
Net financial assets per share
EV of the operating business
EV / FY26E adjusted EBITDA
FCF yield on EV
cash $4.7B + eBay $4.7B + BTC $0.3B − notes $2.8B
$8.30 a share for a retailer earning ~$885M
vs. 12–16x for Five Below / Boot Barn
FY26E free cash flow ~$835M
Collectibles are 45% of sales (from 23% a year ago); gross margin went from 29% to 44% in twelve months; Q2 operating income of $160M was a second-quarter record on revenue that fell 19%.
Management guides FY26 adjusted EBITDA to "in excess of $650M" after a $340M first half; repeating Q2 twice with no seasonality gets to $688M. Our bridge: ~$885M.
EBITDA converts to free cash flow at 120–170% because capex is ~$17M, the cash pile earns interest, and inventory is a source of cash.
GameStop is ~10% of everything PSA grades (our estimate), the largest physical intake network in the fastest-growing collectible category; eBay Pokémon singles hit a record $160M in August, +130% YoY.
The CEO takes no pay, owns 7.8% at a $3.78 average cost, and bought $20.4M two days after the Q2 print, the week the company began reopening stores.
The eBay stake is a free option; the likely outcome is a commercial partnership worth ~$150–365M of EBITDA to GameStop without a merger.
Slide 6 of 34
Executive summary: the six things Wall Street is missing
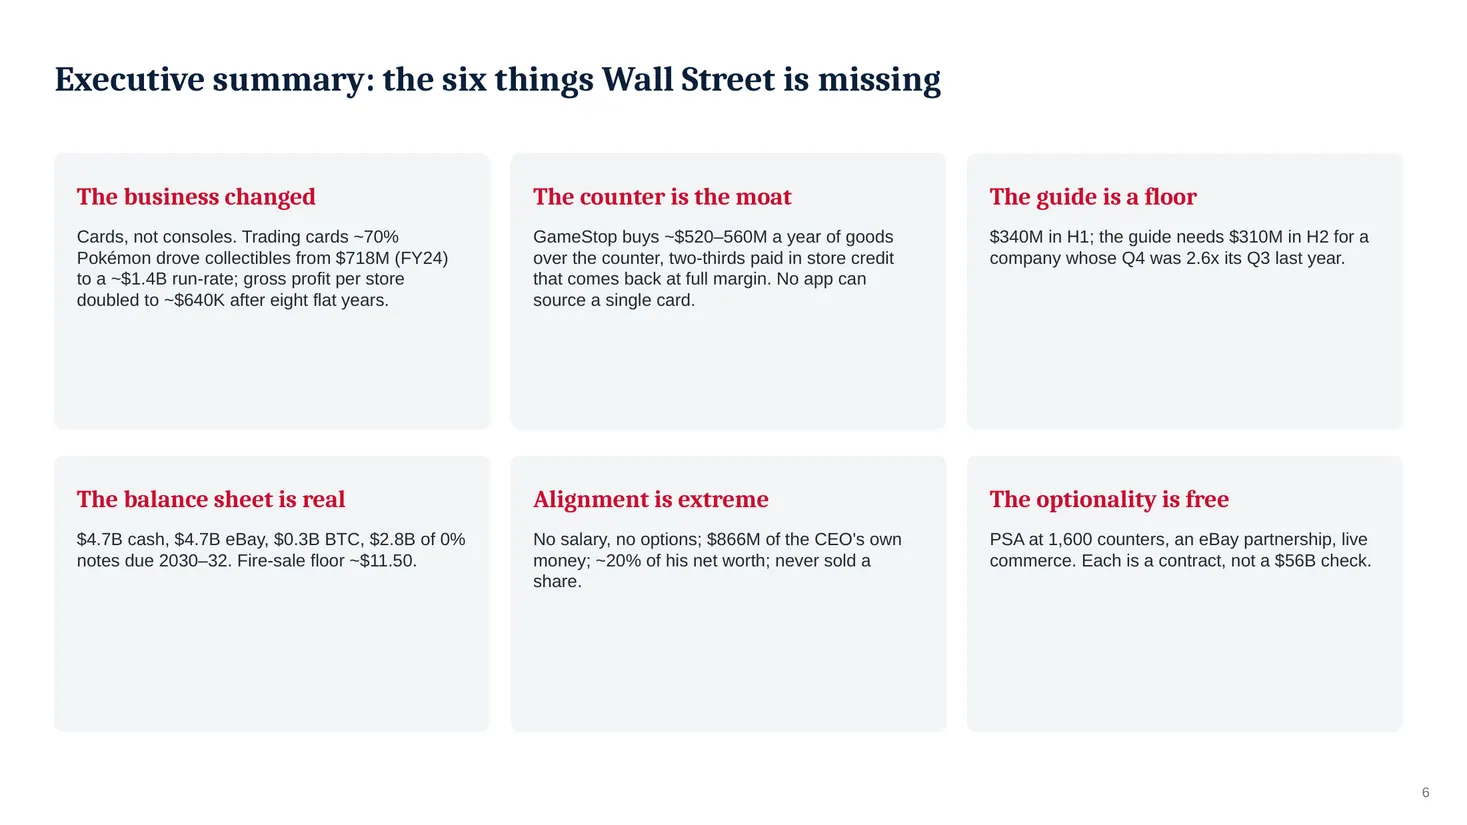
The business changed
The counter is the moat
The guide is a floor
Cards, not consoles. Trading cards ~70% Pokémon drove collectibles from $718M (FY24) to a ~$1.4B run-rate; gross profit per store doubled to ~$640K after eight flat years.
GameStop buys ~$520–560M a year of goods over the counter, two-thirds paid in store credit that comes back at full margin. No app can source a single card.
$340M in H1; the guide needs $310M in H2 for a company whose Q4 was 2.6x its Q3 last year.
The balance sheet is real
Alignment is extreme
The optionality is free
$4.7B cash, $4.7B eBay, $0.3B BTC, $2.8B of 0% notes due 2030–32. Fire-sale floor ~$11.50.
No salary, no options; $866M of the CEO's own money; ~20% of his net worth; never sold a share.
PSA at 1,600 counters, an eBay partnership, live commerce. Each is a contract, not a $56B check.
Slide 7 of 34
The setup: $13.70 a share of cash and securities, then a retailer at 4.7x
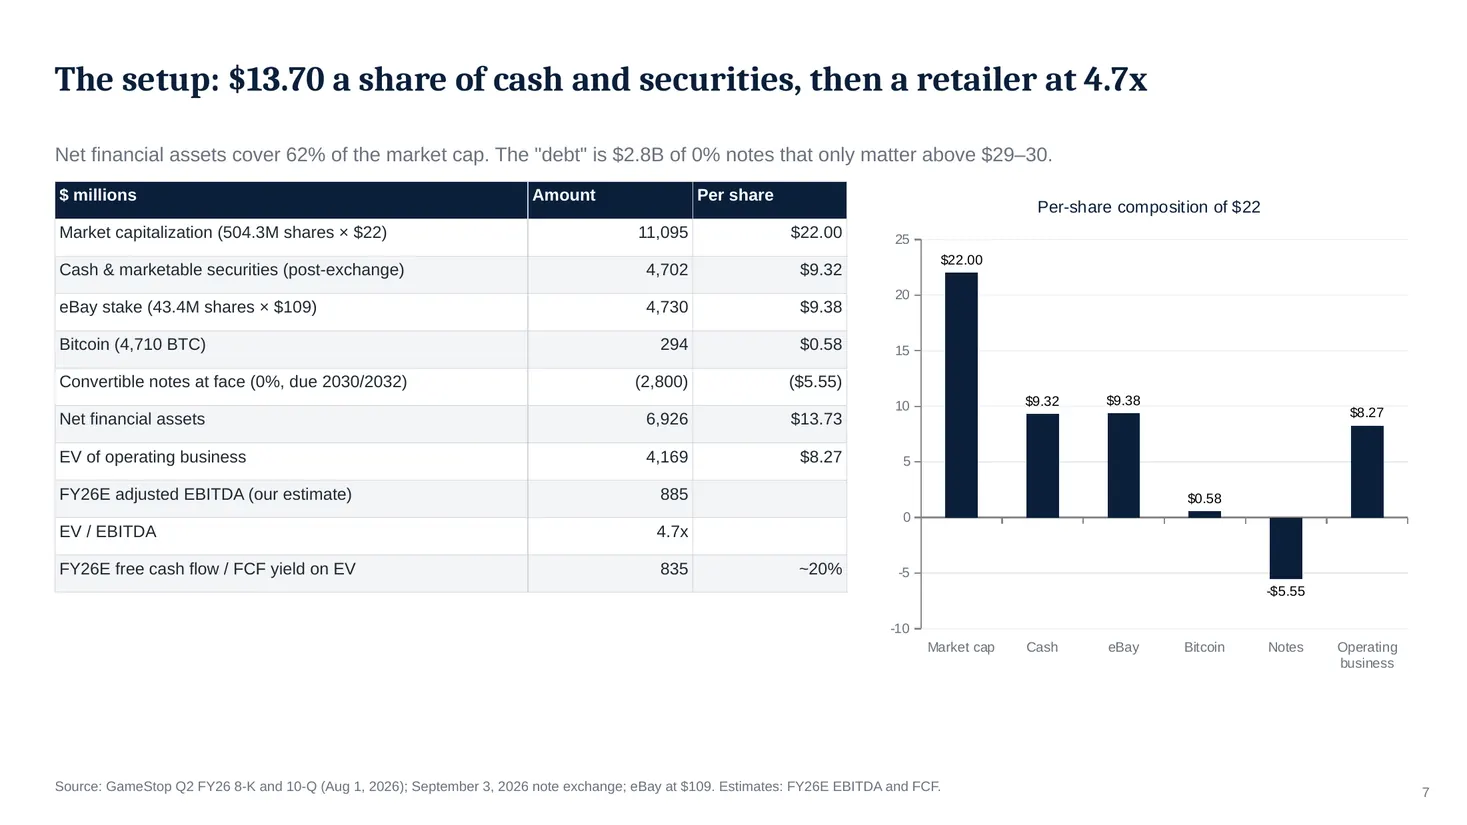
Net financial assets cover 62% of the market cap. The "debt" is $2.8B of 0% notes that only matter above $29–30.
Chart: Per-share composition of $22
| Category | $ per share |
|---|---|
| Market cap | 22.0 |
| Cash | 9.32 |
| eBay | 9.38 |
| Bitcoin | 0.58 |
| Notes | -5.55 |
| Operating business | 8.27 |
| $ millions | Amount | Per share |
|---|---|---|
| Market capitalization (504.3M shares × $22) | 11,095 | $22.00 |
| Cash & marketable securities (post-exchange) | 4,702 | $9.32 |
| eBay stake (43.4M shares × $109) | 4,730 | $9.38 |
| Bitcoin (4,710 BTC) | 294 | $0.58 |
| Convertible notes at face (0%, due 2030/2032) | (2,800) | ($5.55) |
| Net financial assets | 6,926 | $13.73 |
| EV of operating business | 4,169 | $8.27 |
| FY26E adjusted EBITDA (our estimate) | 885 | |
| EV / EBITDA | 4.7x | |
| FY26E free cash flow / FCF yield on EV | 835 | ~20% |
Source: GameStop Q2 FY26 8-K and 10-Q (Aug 1, 2026); September 3, 2026 note exchange; eBay at $109. Estimates: FY26E EBITDA and FCF.
Slide 8 of 34
The guide is a floor: H2 needs $310M; Q2 repeated twice is $348M
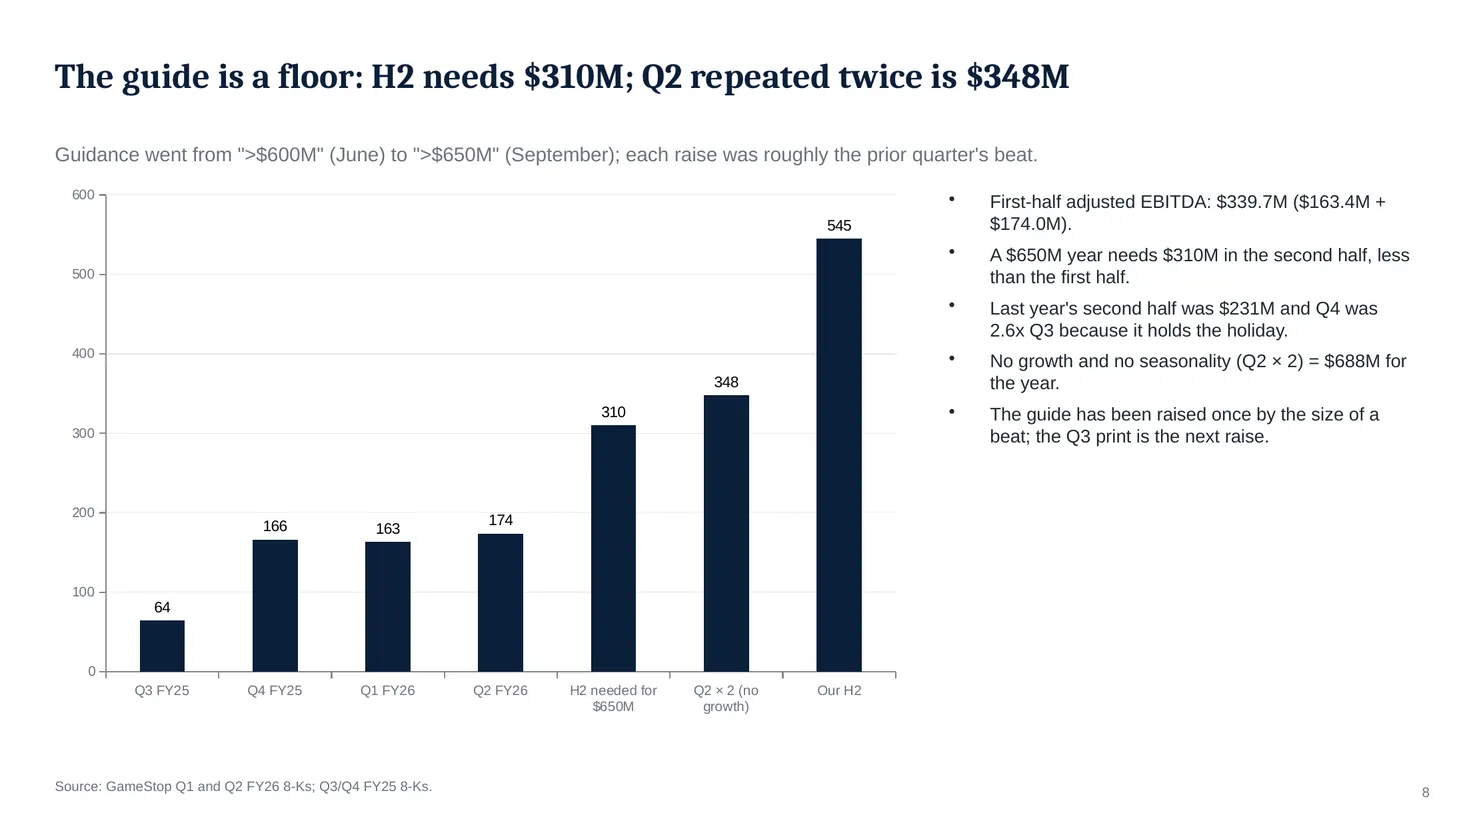
Guidance went from ">$600M" (June) to ">$650M" (September); each raise was roughly the prior quarter's beat.
Chart data
| Category | Adjusted EBITDA ($M) |
|---|---|
| Q3 FY25 | 64.4 |
| Q4 FY25 | 166.4 |
| Q1 FY26 | 163.4 |
| Q2 FY26 | 174.0 |
| H2 needed for $650M | 310.3 |
| Q2 × 2 (no growth) | 348.0 |
| Our H2 | 545.0 |
First-half adjusted EBITDA: $339.7M ($163.4M + $174.0M).
A $650M year needs $310M in the second half, less than the first half.
Last year's second half was $231M and Q4 was 2.6x Q3 because it holds the holiday.
No growth and no seasonality (Q2 × 2) = $688M for the year.
The guide has been raised once by the size of a beat; the Q3 print is the next raise.
Source: GameStop Q1 and Q2 FY26 8-Ks; Q3/Q4 FY25 8-Ks.
Slide 9 of 34
The bridge to ~$885M: the first half plus a normal holiday at Q2's margins
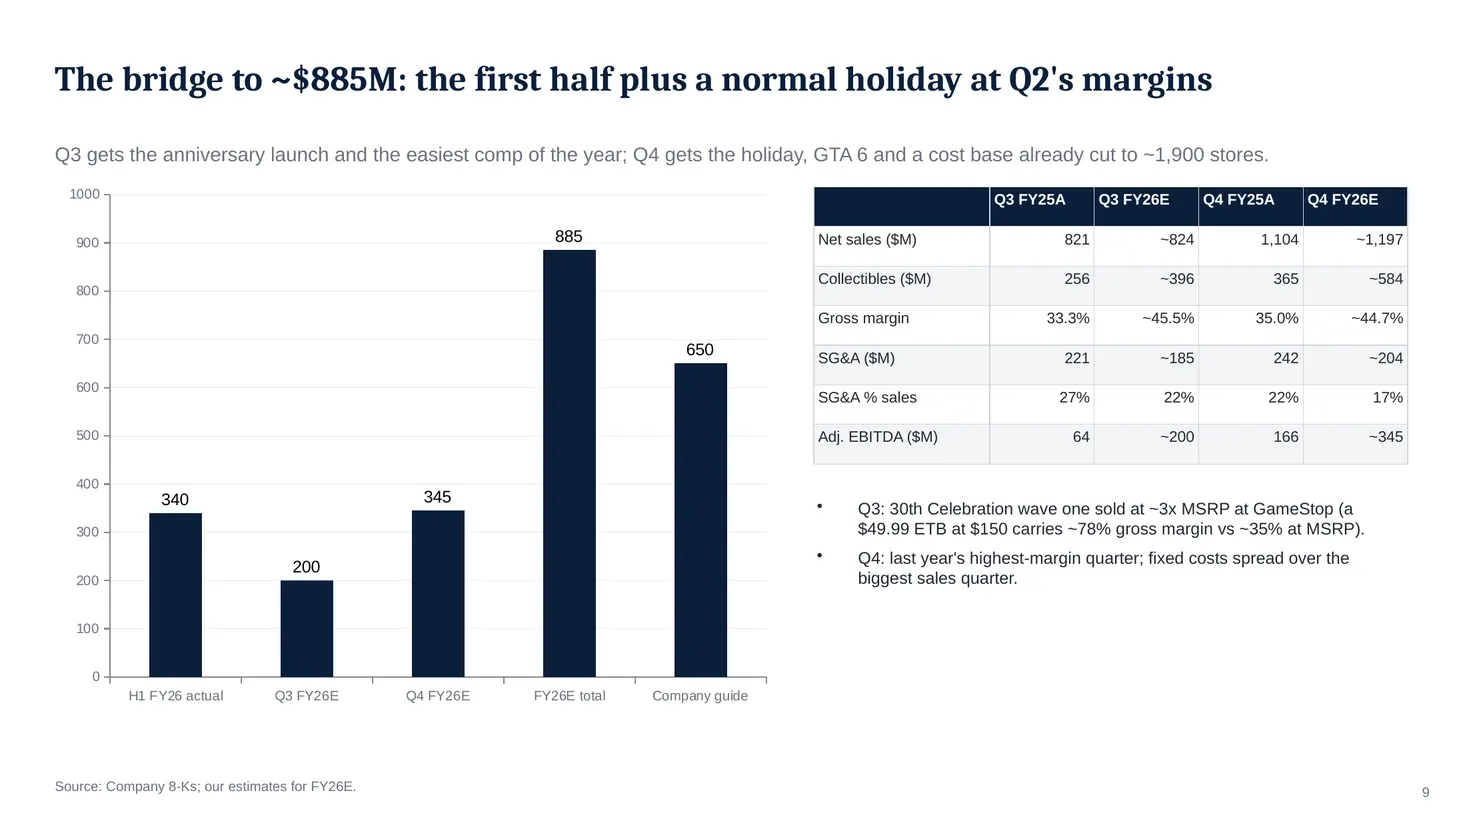
Q3 gets the anniversary launch and the easiest comp of the year; Q4 gets the holiday, GTA 6 and a cost base already cut to ~1,900 stores.
Chart data
| Category | $M |
|---|---|
| H1 FY26 actual | 339.7 |
| Q3 FY26E | 200.0 |
| Q4 FY26E | 345.0 |
| FY26E total | 885.0 |
| Company guide | 650.0 |
| Q3 FY25A | Q3 FY26E | Q4 FY25A | Q4 FY26E | |
|---|---|---|---|---|
| Net sales ($M) | 821 | ~824 | 1,104 | ~1,197 |
| Collectibles ($M) | 256 | ~396 | 365 | ~584 |
| Gross margin | 33.3% | ~45.5% | 35.0% | ~44.7% |
| SG&A ($M) | 221 | ~185 | 242 | ~204 |
| SG&A % sales | 27% | 22% | 22% | 17% |
| Adj. EBITDA ($M) | 64 | ~200 | 166 | ~345 |
Q3: 30th Celebration wave one sold at ~3x MSRP at GameStop (a $49.99 ETB at $150 carries ~78% gross margin vs ~35% at MSRP).
Q4: last year's highest-margin quarter; fixed costs spread over the biggest sales quarter.
Source: Company 8-Ks; our estimates for FY26E.
Slide 10 of 34
Operating leverage: +4% revenue is +15% EBITDA (Q2→Q3); +8% is +100% (Q4 vs Q4)
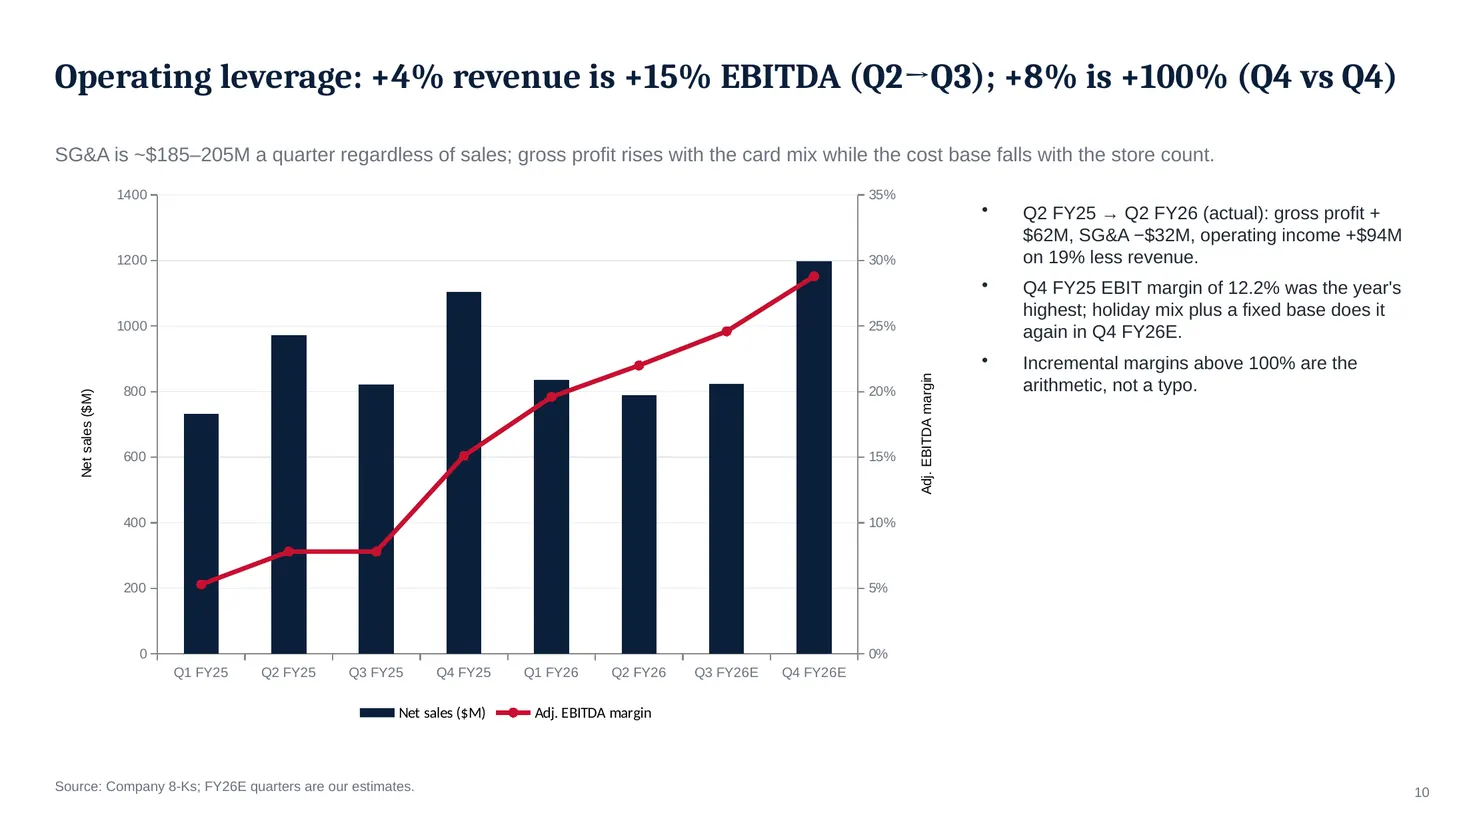
SG&A is ~$185–205M a quarter regardless of sales; gross profit rises with the card mix while the cost base falls with the store count.
Chart data
| Category | Net sales ($M) | Adj. EBITDA margin |
|---|---|---|
| Q1 FY25 | 732.0 | 0.053 |
| Q2 FY25 | 972.0 | 0.078 |
| Q3 FY25 | 821.0 | 0.078 |
| Q4 FY25 | 1104.0 | 0.151 |
| Q1 FY26 | 835.0 | 0.196 |
| Q2 FY26 | 790.0 | 0.22 |
| Q3 FY26E | 824.0 | 0.246 |
| Q4 FY26E | 1197.0 | 0.288 |
Q2 FY25 → Q2 FY26 (actual): gross profit +$62M, SG&A −$32M, operating income +$94M on 19% less revenue.
Q4 FY25 EBIT margin of 12.2% was the year's highest; holiday mix plus a fixed base does it again in Q4 FY26E.
Incremental margins above 100% are the arithmetic, not a typo.
Source: Company 8-Ks; FY26E quarters are our estimates.
Slide 11 of 34
A cash machine in a retailer costume: FCF conversion of 173% (FY25), 121% (TTM)
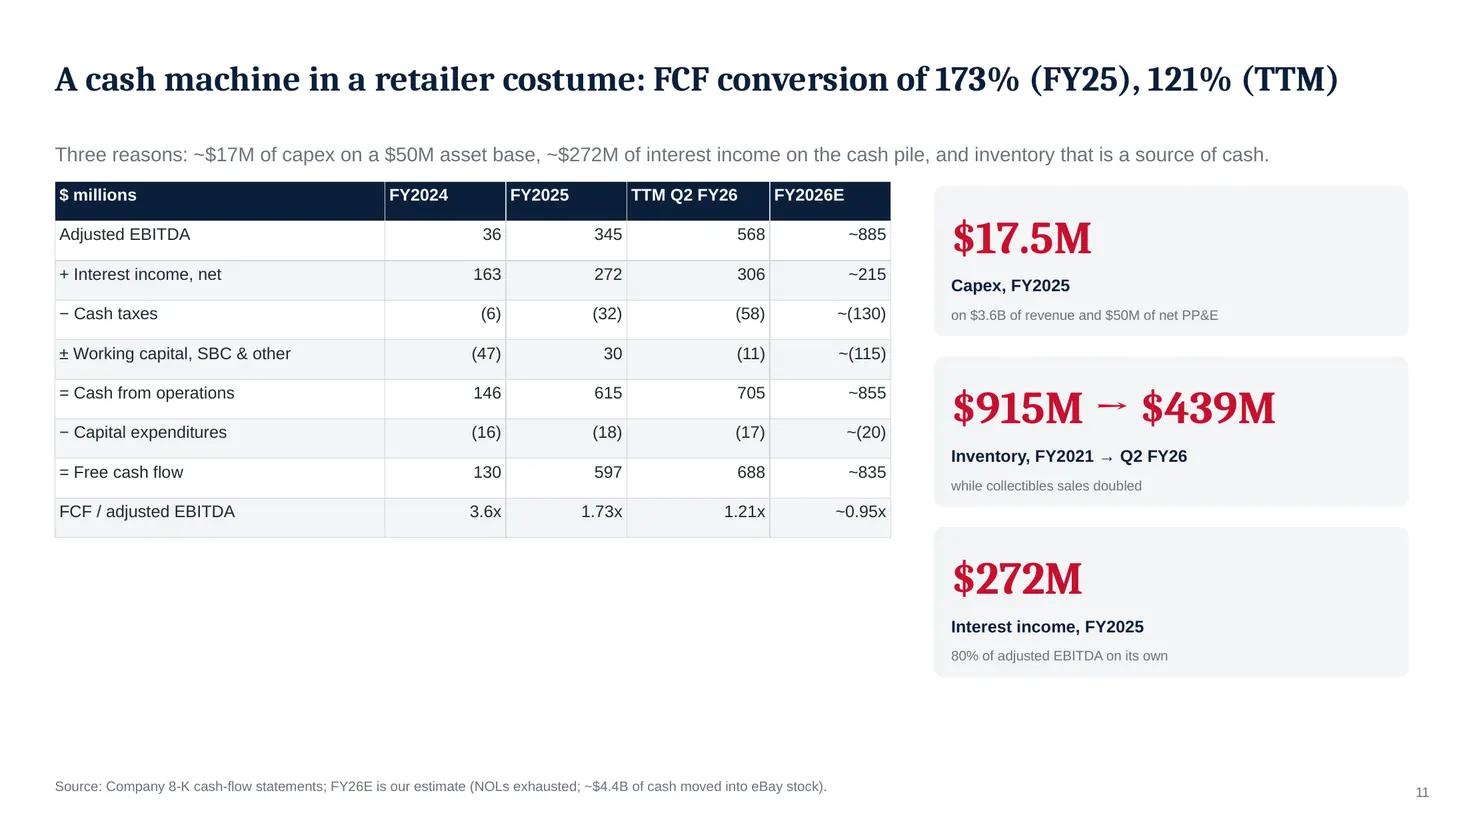
Three reasons: ~$17M of capex on a $50M asset base, ~$272M of interest income on the cash pile, and inventory that is a source of cash.
| $ millions | FY2024 | FY2025 | TTM Q2 FY26 | FY2026E |
|---|---|---|---|---|
| Adjusted EBITDA | 36 | 345 | 568 | ~885 |
| + Interest income, net | 163 | 272 | 306 | ~215 |
| − Cash taxes | (6) | (32) | (58) | ~(130) |
| ± Working capital, SBC & other | (47) | 30 | (11) | ~(115) |
| = Cash from operations | 146 | 615 | 705 | ~855 |
| − Capital expenditures | (16) | (18) | (17) | ~(20) |
| = Free cash flow | 130 | 597 | 688 | ~835 |
| FCF / adjusted EBITDA | 3.6x | 1.73x | 1.21x | ~0.95x |
$17.5M
Capex, FY2025
on $3.6B of revenue and $50M of net PP&E
$915M → $439M
Inventory, FY2021 → Q2 FY26
while collectibles sales doubled
$272M
Interest income, FY2025
80% of adjusted EBITDA on its own
Source: Company 8-K cash-flow statements; FY26E is our estimate (NOLs exhausted; ~$4.4B of cash moved into eBay stock).
Slide 12 of 34
The business changed: collectibles went from 6% of sales to 45%
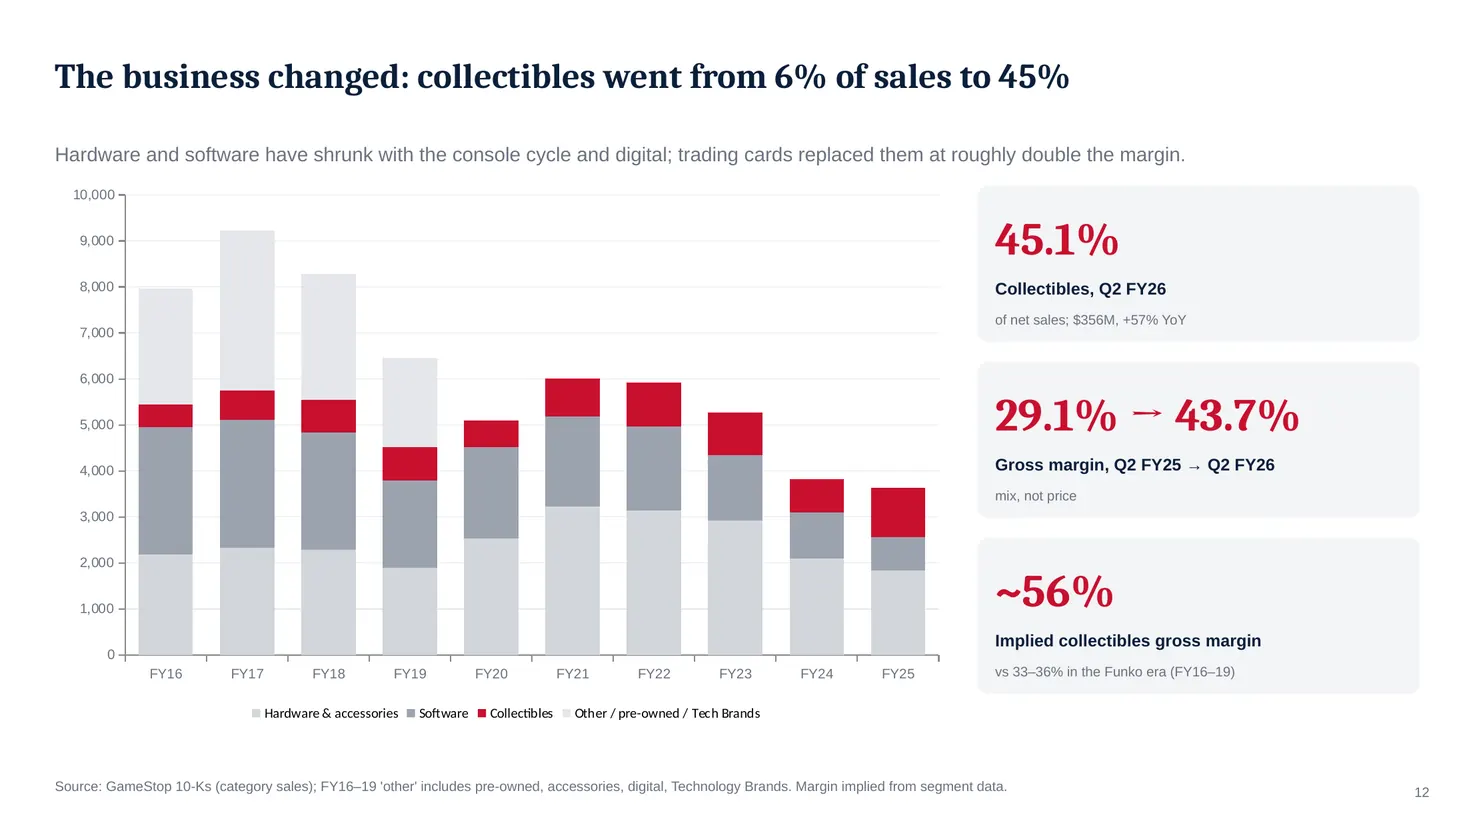
Hardware and software have shrunk with the console cycle and digital; trading cards replaced them at roughly double the margin.
Chart data
| Category | Hardware & accessories | Software | Collectibles | Other / pre-owned / Tech Brands |
|---|---|---|---|---|
| FY16 | 2190.0 | 2761.0 | 494.0 | 2520.0 |
| FY17 | 2333.0 | 2784.0 | 636.0 | 3472.0 |
| FY18 | 2284.0 | 2555.0 | 708.0 | 2738.0 |
| FY19 | 1891.0 | 1896.0 | 737.0 | 1942.0 |
| FY20 | 2533.0 | 1978.0 | 580.0 | 0.0 |
| FY21 | 3232.0 | 1956.0 | 824.0 | 0.0 |
| FY22 | 3141.0 | 1822.0 | 965.0 | 0.0 |
| FY23 | 2926.0 | 1412.0 | 935.0 | 0.0 |
| FY24 | 2100.0 | 1005.0 | 718.0 | 0.0 |
| FY25 | 1840.0 | 729.0 | 1060.0 | 0.0 |
45.1%
Collectibles, Q2 FY26
of net sales; $356M, +57% YoY
29.1% → 43.7%
Gross margin, Q2 FY25 → Q2 FY26
mix, not price
~56%
Implied collectibles gross margin
vs 33–36% in the Funko era (FY16–19)
Source: GameStop 10-Ks (category sales); FY16–19 'other' includes pre-owned, accessories, digital, Technology Brands. Margin implied from segment data.
Slide 13 of 34
Gross margin: 44% and rising with the mix
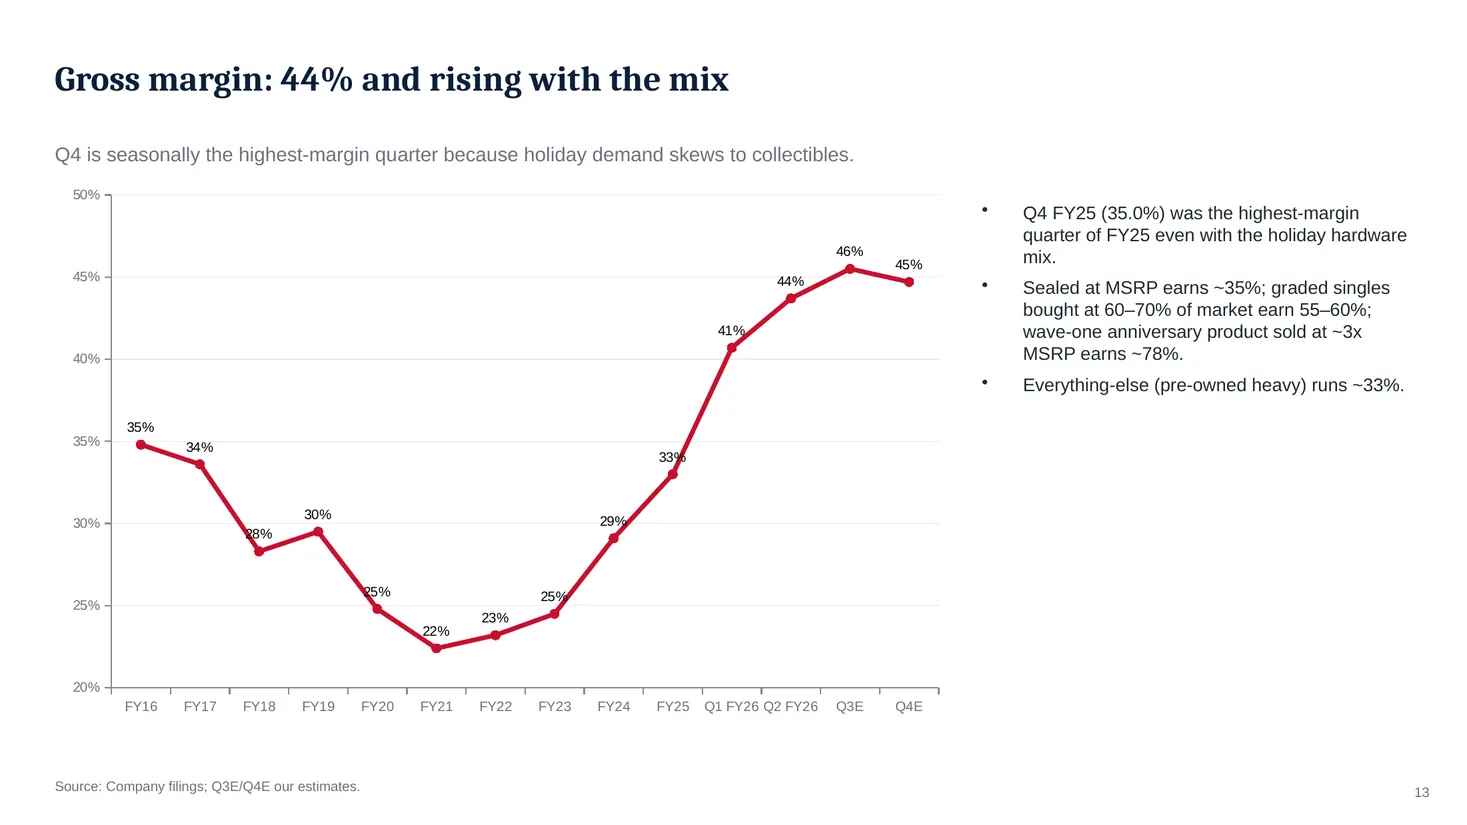
Q4 is seasonally the highest-margin quarter because holiday demand skews to collectibles.
Chart data
| Category | Gross margin |
|---|---|
| FY16 | 0.348 |
| FY17 | 0.336 |
| FY18 | 0.283 |
| FY19 | 0.295 |
| FY20 | 0.248 |
| FY21 | 0.224 |
| FY22 | 0.232 |
| FY23 | 0.245 |
| FY24 | 0.291 |
| FY25 | 0.33 |
| Q1 FY26 | 0.407 |
| Q2 FY26 | 0.437 |
| Q3E | 0.455 |
| Q4E | 0.447 |
Q4 FY25 (35.0%) was the highest-margin quarter of FY25 even with the holiday hardware mix.
Sealed at MSRP earns ~35%; graded singles bought at 60–70% of market earn 55–60%; wave-one anniversary product sold at ~3x MSRP earns ~78%.
Everything-else (pre-owned heavy) runs ~33%.
Source: Company filings; Q3E/Q4E our estimates.
Slide 14 of 34
They closed 5,600 stores and gross profit per store doubled anyway
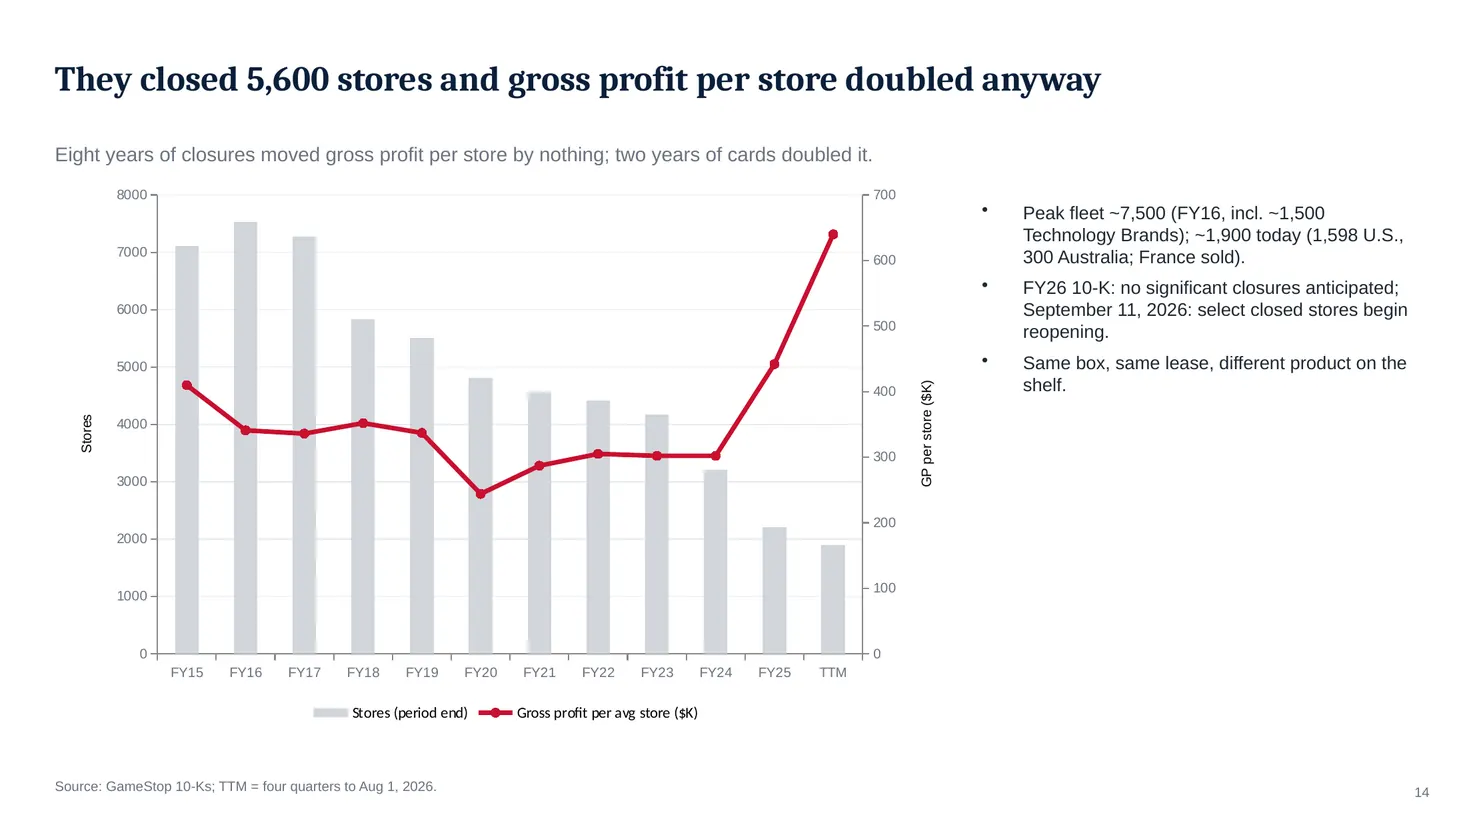
Eight years of closures moved gross profit per store by nothing; two years of cards doubled it.
Chart data
| Category | Stores (period end) | Gross profit per avg store ($K) |
|---|---|---|
| FY15 | 7117.0 | 410.0 |
| FY16 | 7535.0 | 341.0 |
| FY17 | 7276.0 | 336.0 |
| FY18 | 5830.0 | 352.0 |
| FY19 | 5509.0 | 337.0 |
| FY20 | 4816.0 | 244.0 |
| FY21 | 4573.0 | 287.0 |
| FY22 | 4413.0 | 305.0 |
| FY23 | 4169.0 | 302.0 |
| FY24 | 3203.0 | 302.0 |
| FY25 | 2206.0 | 442.0 |
| TTM | 1898.0 | 640.0 |
Peak fleet ~7,500 (FY16, incl. ~1,500 Technology Brands); ~1,900 today (1,598 U.S., 300 Australia; France sold).
FY26 10-K: no significant closures anticipated; September 11, 2026: select closed stores begin reopening.
Same box, same lease, different product on the shelf.
Source: GameStop 10-Ks; TTM = four quarters to Aug 1, 2026.
Slide 15 of 34
Four-wall economics that belong in a different industry
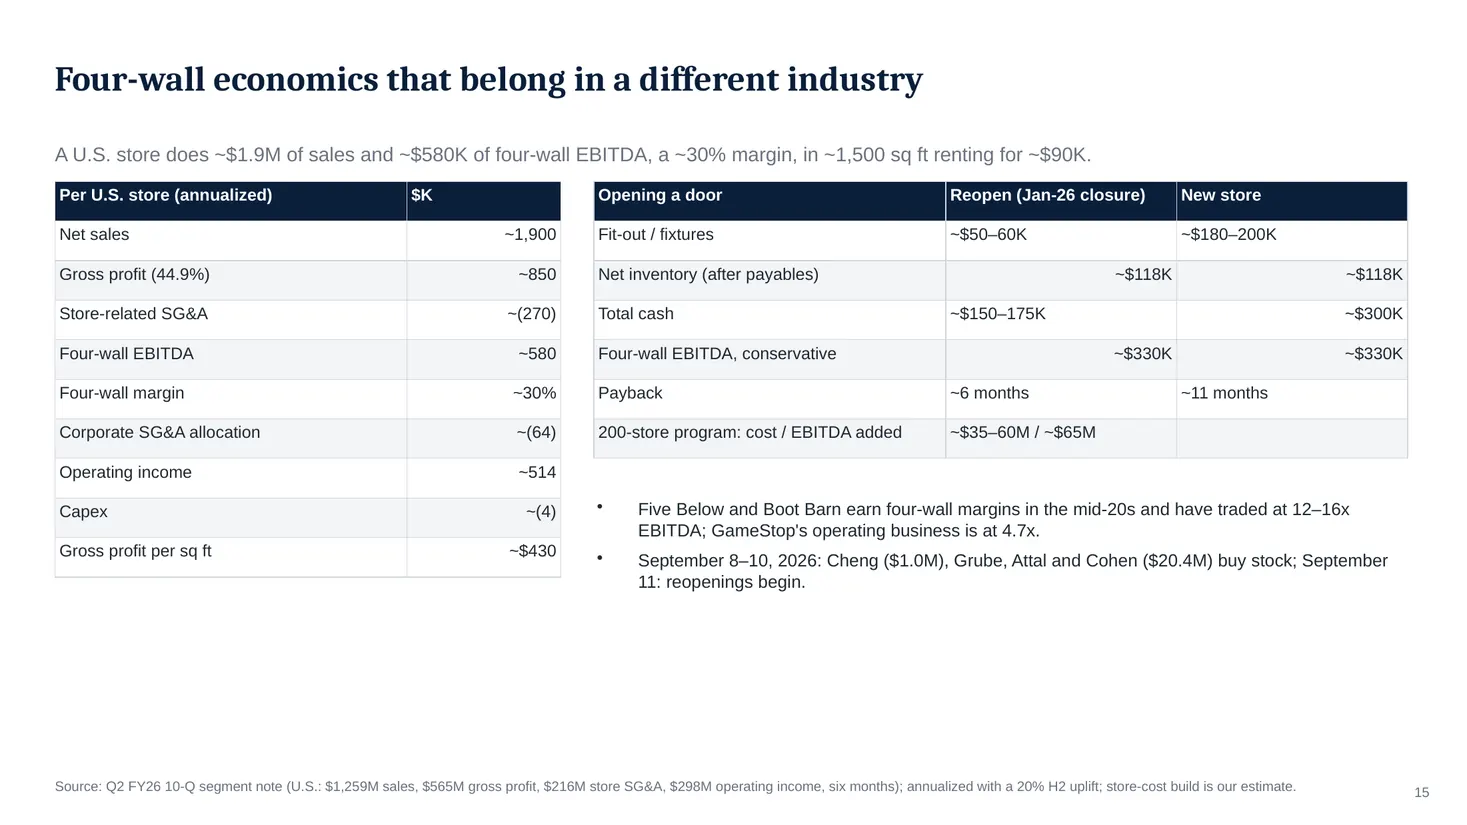
A U.S. store does ~$1.9M of sales and ~$580K of four-wall EBITDA, a ~30% margin, in ~1,500 sq ft renting for ~$90K.
| Per U.S. store (annualized) | $K |
|---|---|
| Net sales | ~1,900 |
| Gross profit (44.9%) | ~850 |
| Store-related SG&A | ~(270) |
| Four-wall EBITDA | ~580 |
| Four-wall margin | ~30% |
| Corporate SG&A allocation | ~(64) |
| Operating income | ~514 |
| Capex | ~(4) |
| Gross profit per sq ft | ~$430 |
| Opening a door | Reopen (Jan-26 closure) | New store |
|---|---|---|
| Fit-out / fixtures | ~$50–60K | ~$180–200K |
| Net inventory (after payables) | ~$118K | ~$118K |
| Total cash | ~$150–175K | ~$300K |
| Four-wall EBITDA, conservative | ~$330K | ~$330K |
| Payback | ~6 months | ~11 months |
| 200-store program: cost / EBITDA added | ~$35–60M / ~$65M |
Five Below and Boot Barn earn four-wall margins in the mid-20s and have traded at 12–16x EBITDA; GameStop's operating business is at 4.7x.
September 8–10, 2026: Cheng ($1.0M), Grube, Attal and Cohen ($20.4M) buy stock; September 11: reopenings begin.
Source: Q2 FY26 10-Q segment note (U.S.: $1,259M sales, $565M gross profit, $216M store SG&A, $298M operating income, six months); annualized with a 20% H2 uplift; store-cost build is our estimate.
Slide 16 of 34
The trade-in counter is the moat: ~$520–560M a year bought from customers
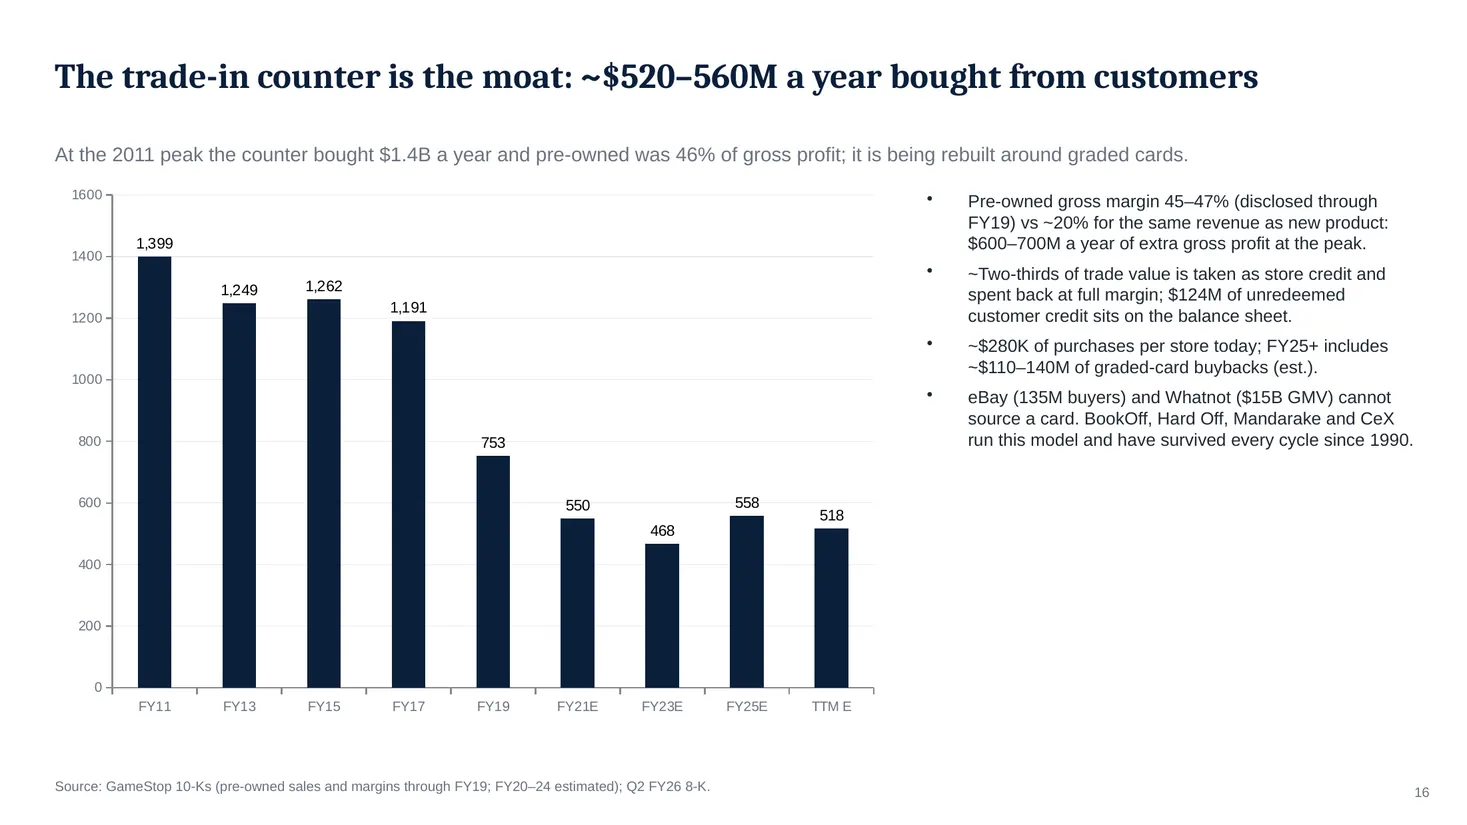
At the 2011 peak the counter bought $1.4B a year and pre-owned was 46% of gross profit; it is being rebuilt around graded cards.
Chart data
| Category | Purchases from customers ($M) |
|---|---|
| FY11 | 1399.0 |
| FY13 | 1249.0 |
| FY15 | 1262.0 |
| FY17 | 1191.0 |
| FY19 | 753.0 |
| FY21E | 550.0 |
| FY23E | 468.0 |
| FY25E | 558.0 |
| TTM E | 518.0 |
Pre-owned gross margin 45–47% (disclosed through FY19) vs ~20% for the same revenue as new product: $600–700M a year of extra gross profit at the peak.
~Two-thirds of trade value is taken as store credit and spent back at full margin; $124M of unredeemed customer credit sits on the balance sheet.
~$280K of purchases per store today; FY25+ includes ~$110–140M of graded-card buybacks (est.).
eBay (135M buyers) and Whatnot ($15B GMV) cannot source a card. BookOff, Hard Off, Mandarake and CeX run this model and have survived every cycle since 1990.
Source: GameStop 10-Ks (pre-owned sales and margins through FY19; FY20–24 estimated); Q2 FY26 8-K.
Slide 17 of 34
The trade-in counter is also a float business, and nobody values it as one
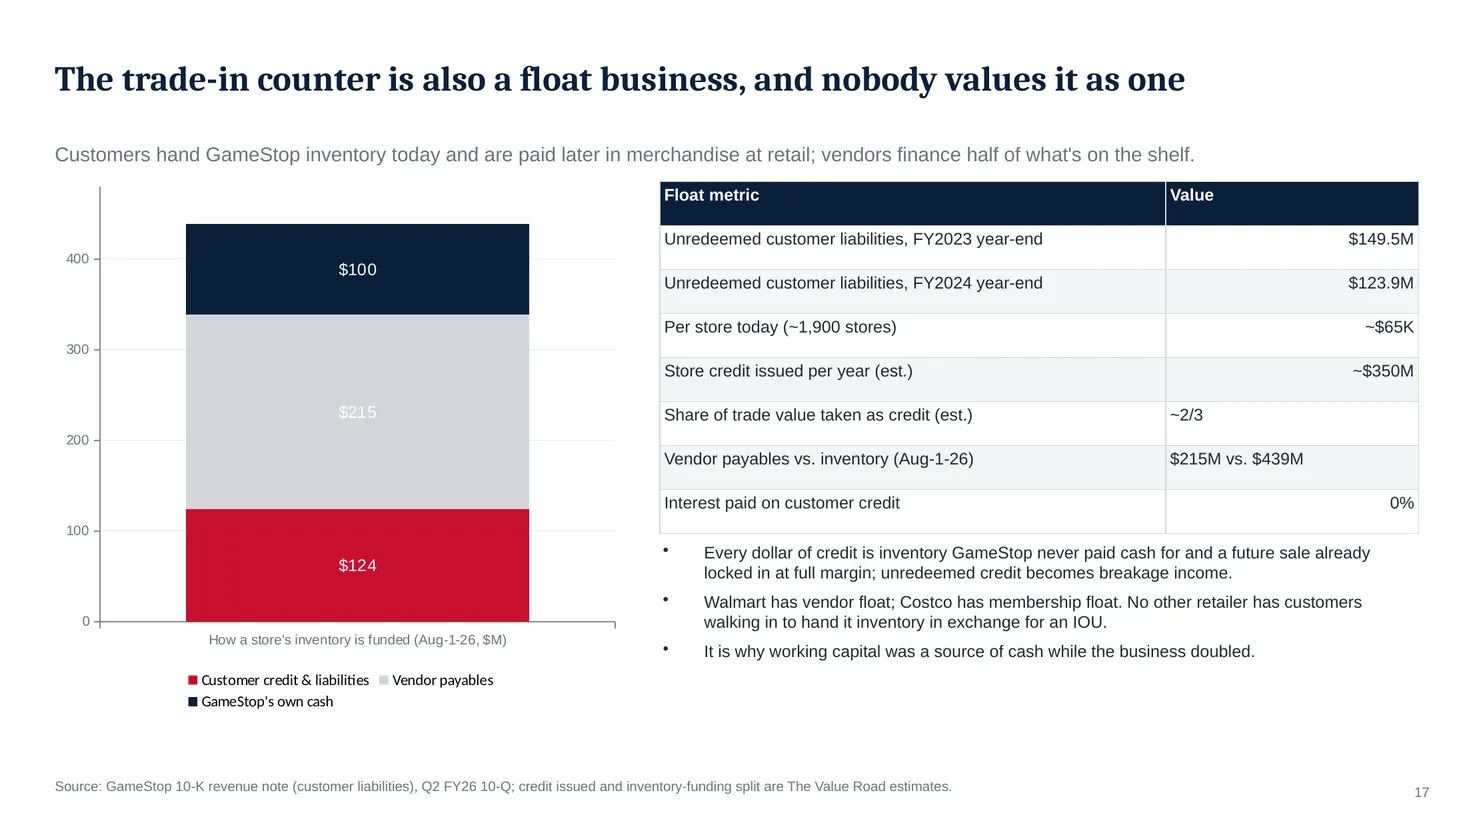
Customers hand GameStop inventory today and are paid later in merchandise at retail; vendors finance half of what's on the shelf.
Chart data
| Category | Customer credit & liabilities | Vendor payables | GameStop's own cash |
|---|---|---|---|
| How a store's inventory is funded (Aug-1-26, $M) | 124.0 | 215.0 | 100.0 |
| Float metric | Value |
|---|---|
| Unredeemed customer liabilities, FY2023 year-end | $149.5M |
| Unredeemed customer liabilities, FY2024 year-end | $123.9M |
| Per store today (~1,900 stores) | ~$65K |
| Store credit issued per year (est.) | ~$350M |
| Share of trade value taken as credit (est.) | ~2/3 |
| Vendor payables vs. inventory (Aug-1-26) | $215M vs. $439M |
| Interest paid on customer credit | 0% |
Every dollar of credit is inventory GameStop never paid cash for and a future sale already locked in at full margin; unredeemed credit becomes breakage income.
Walmart has vendor float; Costco has membership float. No other retailer has customers walking in to hand it inventory in exchange for an IOU.
It is why working capital was a source of cash while the business doubled.
Source: GameStop 10-K revenue note (customer liabilities), Q2 FY26 10-Q; credit issued and inventory-funding split are The Value Road estimates.
Slide 18 of 34
Demand: eBay Pokémon singles hit a record $160M in August, +130% YoY
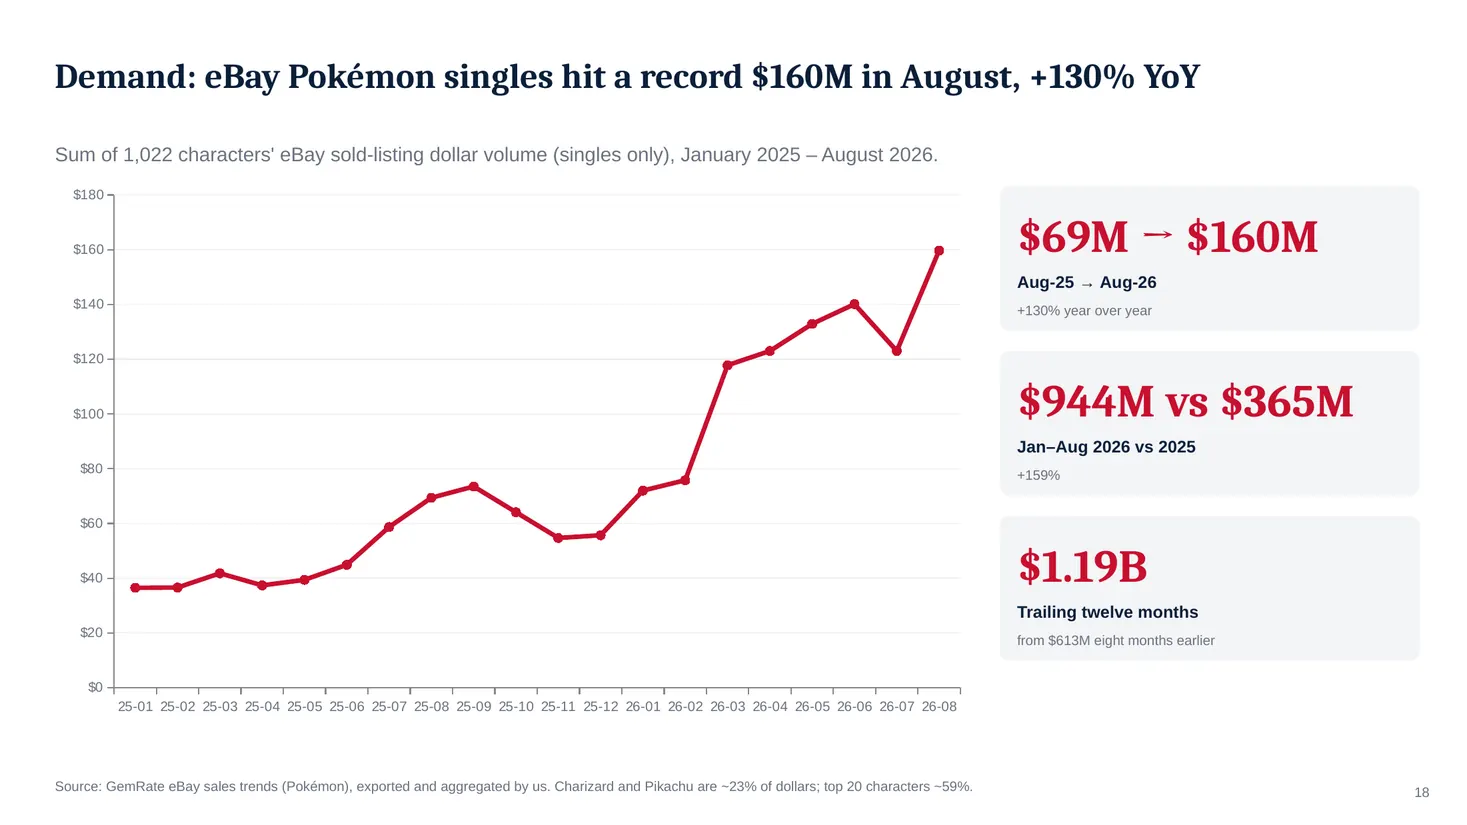
Sum of 1,022 characters' eBay sold-listing dollar volume (singles only), January 2025 – August 2026.
Chart data
| Category | eBay Pokémon singles ($M/month) |
|---|---|
| 25-01 | 36.5 |
| 25-02 | 36.6 |
| 25-03 | 41.8 |
| 25-04 | 37.4 |
| 25-05 | 39.4 |
| 25-06 | 44.9 |
| 25-07 | 58.7 |
| 25-08 | 69.4 |
| 25-09 | 73.5 |
| 25-10 | 64.1 |
| 25-11 | 54.7 |
| 25-12 | 55.7 |
| 26-01 | 72.0 |
| 26-02 | 75.8 |
| 26-03 | 117.8 |
| 26-04 | 123.0 |
| 26-05 | 132.9 |
| 26-06 | 140.1 |
| 26-07 | 123.0 |
| 26-08 | 159.7 |
$69M → $160M
Aug-25 → Aug-26
+130% year over year
$944M vs $365M
Jan–Aug 2026 vs 2025
+159%
$1.19B
Trailing twelve months
from $613M eight months earlier
Source: GemRate eBay sales trends (Pokémon), exported and aggregated by us. Charizard and Pikachu are ~23% of dollars; top 20 characters ~59%.
Slide 19 of 34
Grading: ~40M cards annualized (+40–50%); GameStop is ~10% of PSA's volume (est.)
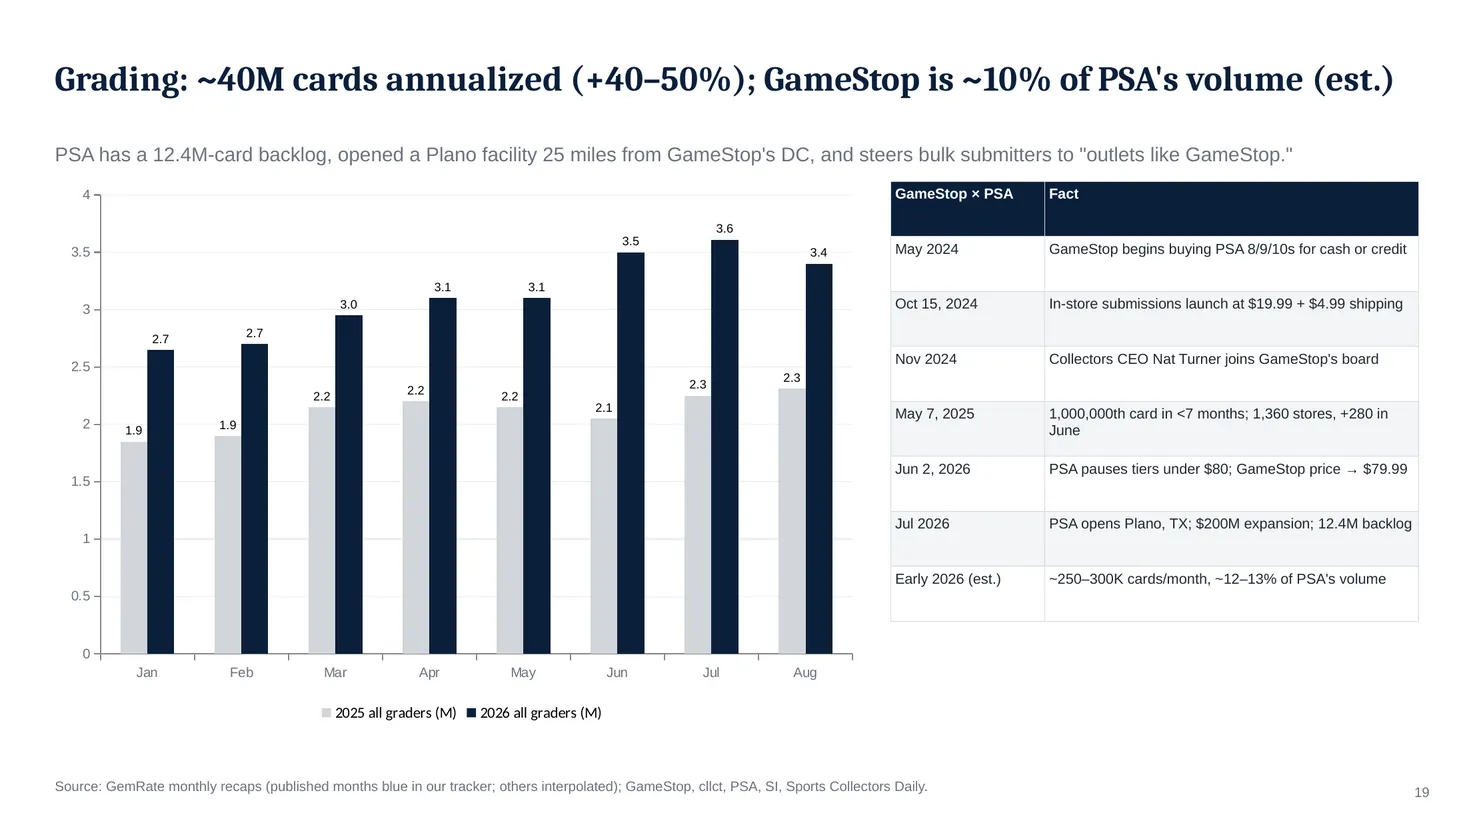
PSA has a 12.4M-card backlog, opened a Plano facility 25 miles from GameStop's DC, and steers bulk submitters to "outlets like GameStop."
Chart data
| Category | 2025 all graders (M) | 2026 all graders (M) |
|---|---|---|
| Jan | 1.85 | 2.65 |
| Feb | 1.9 | 2.7 |
| Mar | 2.15 | 2.95 |
| Apr | 2.2 | 3.1 |
| May | 2.15 | 3.1 |
| Jun | 2.05 | 3.5 |
| Jul | 2.25 | 3.61 |
| Aug | 2.31 | 3.4 |
| GameStop × PSA | Fact |
|---|---|
| May 2024 | GameStop begins buying PSA 8/9/10s for cash or credit |
| Oct 15, 2024 | In-store submissions launch at $19.99 + $4.99 shipping |
| Nov 2024 | Collectors CEO Nat Turner joins GameStop's board |
| May 7, 2025 | 1,000,000th card in <7 months; 1,360 stores, +280 in June |
| Jun 2, 2026 | PSA pauses tiers under $80; GameStop price → $79.99 |
| Jul 2026 | PSA opens Plano, TX; $200M expansion; 12.4M backlog |
| Early 2026 (est.) | ~250–300K cards/month, ~12–13% of PSA's volume |
Source: GemRate monthly recaps (published months blue in our tracker; others interpolated); GameStop, cllct, PSA, SI, Sports Collectors Daily.
Slide 20 of 34
The 30th Celebration landed inside Q3 and sold out before sunrise
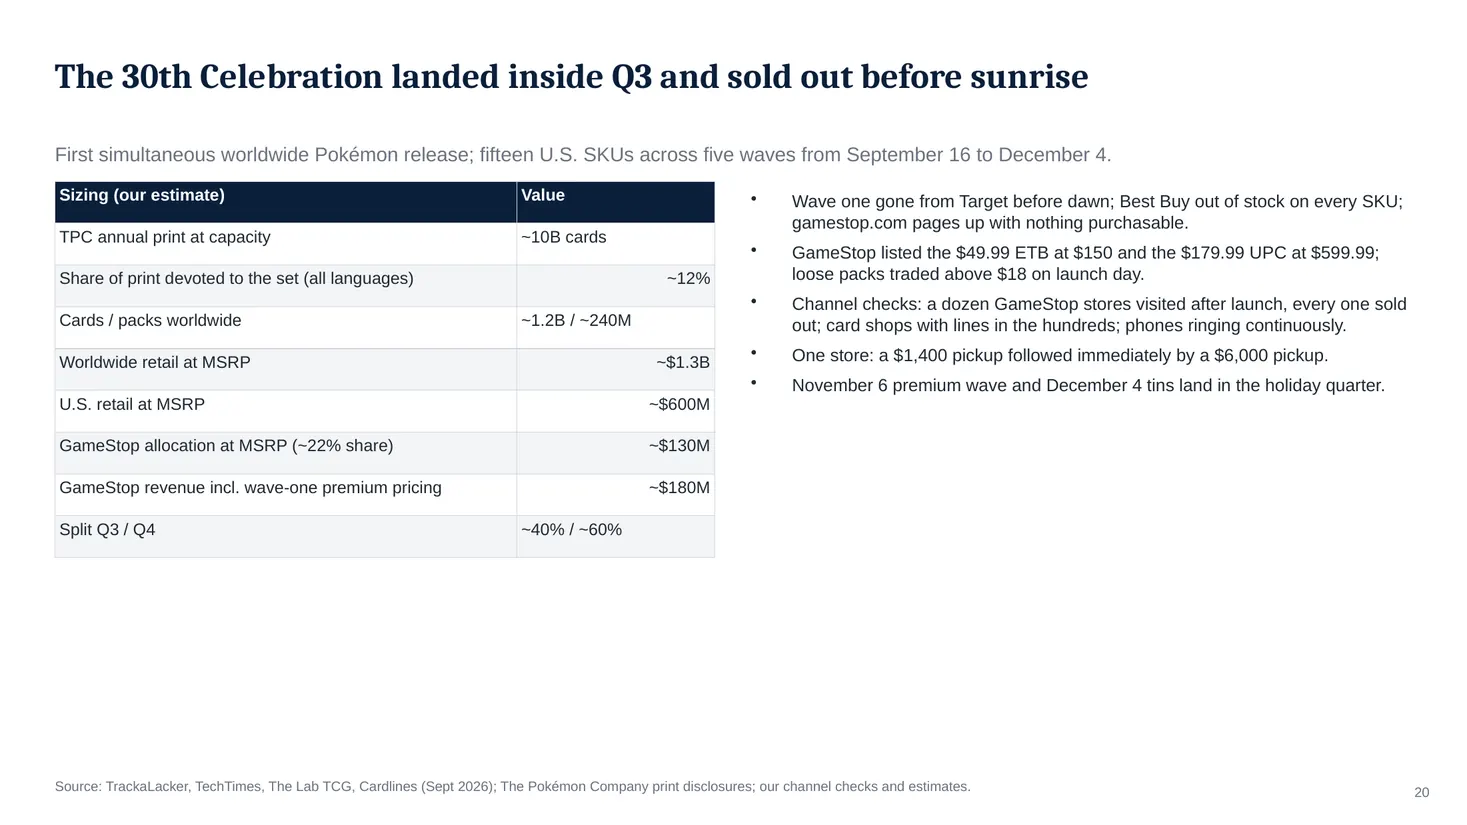
First simultaneous worldwide Pokémon release; fifteen U.S. SKUs across five waves from September 16 to December 4.
| Sizing (our estimate) | Value |
|---|---|
| TPC annual print at capacity | ~10B cards |
| Share of print devoted to the set (all languages) | ~12% |
| Cards / packs worldwide | ~1.2B / ~240M |
| Worldwide retail at MSRP | ~$1.3B |
| U.S. retail at MSRP | ~$600M |
| GameStop allocation at MSRP (~22% share) | ~$130M |
| GameStop revenue incl. wave-one premium pricing | ~$180M |
| Split Q3 / Q4 | ~40% / ~60% |
Wave one gone from Target before dawn; Best Buy out of stock on every SKU; gamestop.com pages up with nothing purchasable.
GameStop listed the $49.99 ETB at $150 and the $179.99 UPC at $599.99; loose packs traded above $18 on launch day.
Channel checks: a dozen GameStop stores visited after launch, every one sold out; card shops with lines in the hundreds; phones ringing continuously.
One store: a $1,400 pickup followed immediately by a $6,000 pickup.
November 6 premium wave and December 4 tins land in the holiday quarter.
Source: TrackaLacker, TechTimes, The Lab TCG, Cardlines (Sept 2026); The Pokémon Company print disclosures; our channel checks and estimates.
Slide 21 of 34
Four centuries of cycles: the counter and the grader survive; the hot product does not
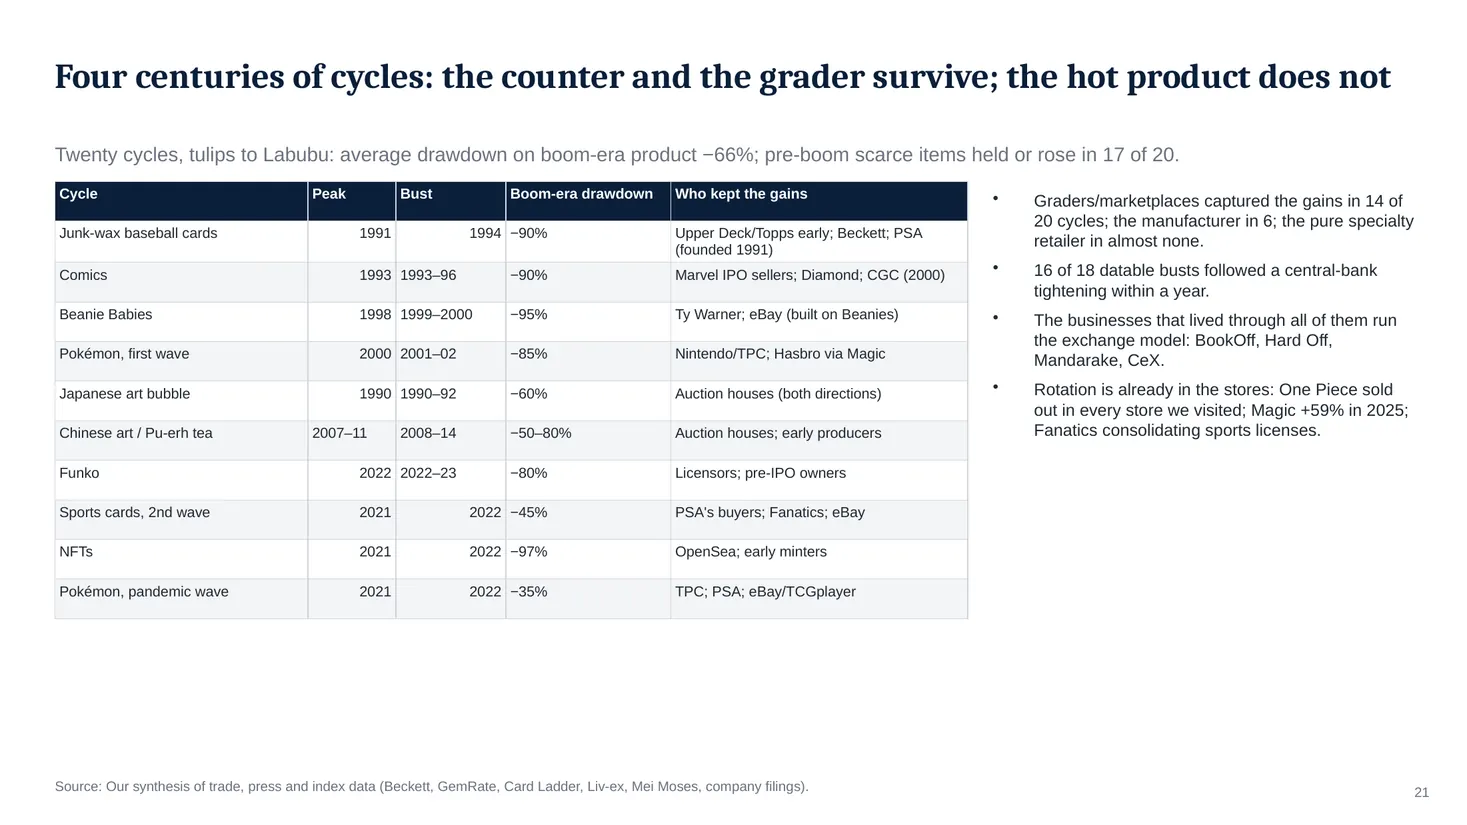
Twenty cycles, tulips to Labubu: average drawdown on boom-era product −66%; pre-boom scarce items held or rose in 17 of 20.
| Cycle | Peak | Bust | Boom-era drawdown | Who kept the gains |
|---|---|---|---|---|
| Junk-wax baseball cards | 1991 | 1994 | −90% | Upper Deck/Topps early; Beckett; PSA (founded 1991) |
| Comics | 1993 | 1993–96 | −90% | Marvel IPO sellers; Diamond; CGC (2000) |
| Beanie Babies | 1998 | 1999–2000 | −95% | Ty Warner; eBay (built on Beanies) |
| Pokémon, first wave | 2000 | 2001–02 | −85% | Nintendo/TPC; Hasbro via Magic |
| Japanese art bubble | 1990 | 1990–92 | −60% | Auction houses (both directions) |
| Chinese art / Pu-erh tea | 2007–11 | 2008–14 | −50–80% | Auction houses; early producers |
| Funko | 2022 | 2022–23 | −80% | Licensors; pre-IPO owners |
| Sports cards, 2nd wave | 2021 | 2022 | −45% | PSA's buyers; Fanatics; eBay |
| NFTs | 2021 | 2022 | −97% | OpenSea; early minters |
| Pokémon, pandemic wave | 2021 | 2022 | −35% | TPC; PSA; eBay/TCGplayer |
Graders/marketplaces captured the gains in 14 of 20 cycles; the manufacturer in 6; the pure specialty retailer in almost none.
16 of 18 datable busts followed a central-bank tightening within a year.
The businesses that lived through all of them run the exchange model: BookOff, Hard Off, Mandarake, CeX.
Rotation is already in the stores: One Piece sold out in every store we visited; Magic +59% in 2025; Fanatics consolidating sports licenses.
Source: Our synthesis of trade, press and index data (Beckett, GemRate, Card Ladder, Liv-ex, Mei Moses, company filings).
Slide 22 of 34
Macro: collectibles trade as a liquidity asset, and the liquidity is coming
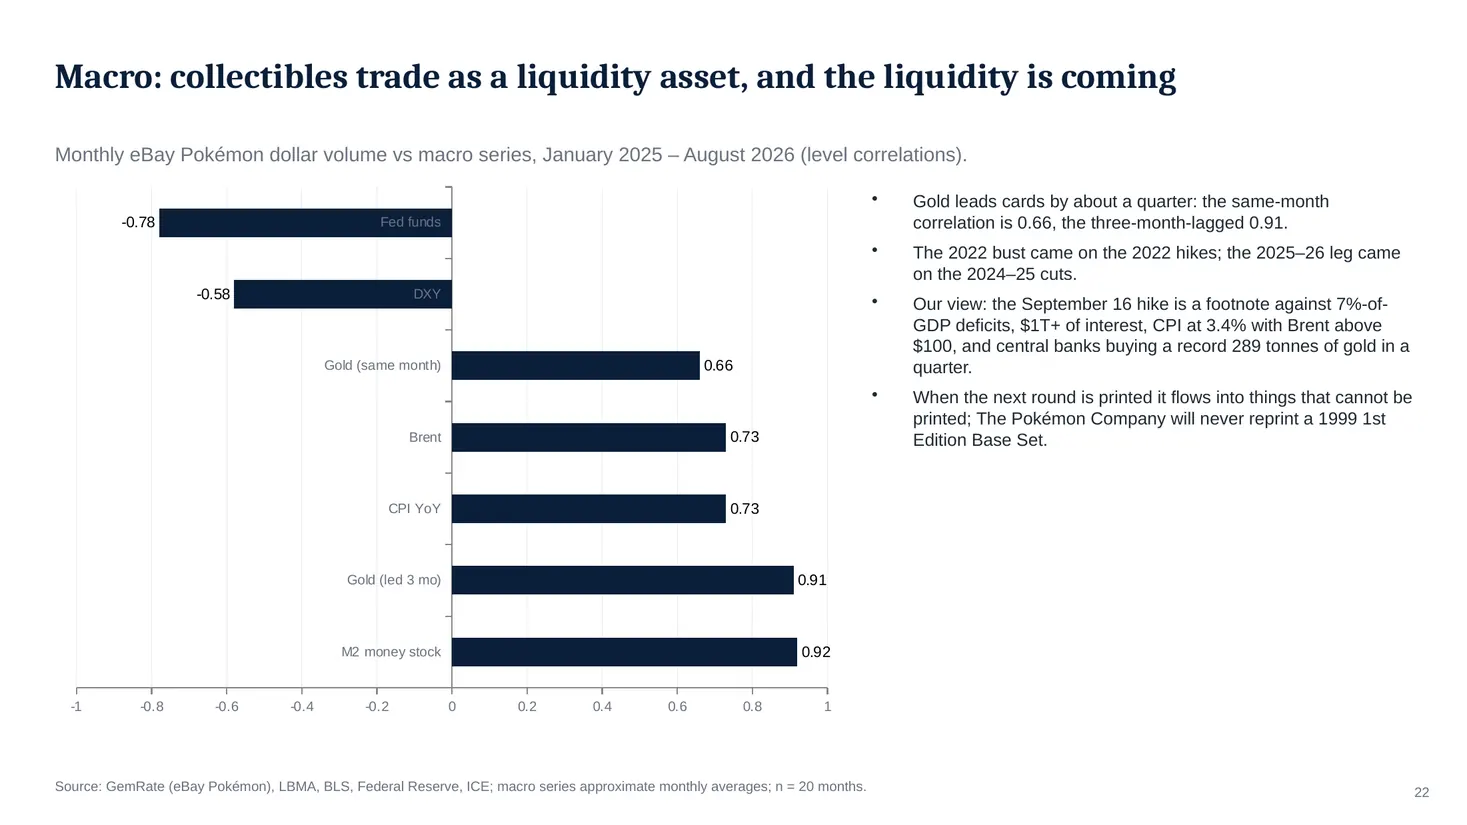
Monthly eBay Pokémon dollar volume vs macro series, January 2025 – August 2026 (level correlations).
Chart data
| Category | Correlation |
|---|---|
| M2 money stock | 0.92 |
| Gold (led 3 mo) | 0.91 |
| CPI YoY | 0.73 |
| Brent | 0.73 |
| Gold (same month) | 0.66 |
| DXY | -0.58 |
| Fed funds | -0.78 |
Gold leads cards by about a quarter: the same-month correlation is 0.66, the three-month-lagged 0.91.
The 2022 bust came on the 2022 hikes; the 2025–26 leg came on the 2024–25 cuts.
Our view: the September 16 hike is a footnote against 7%-of-GDP deficits, $1T+ of interest, CPI at 3.4% with Brent above $100, and central banks buying a record 289 tonnes of gold in a quarter.
When the next round is printed it flows into things that cannot be printed; The Pokémon Company will never reprint a 1999 1st Edition Base Set.
Source: GemRate (eBay Pokémon), LBMA, BLS, Federal Reserve, ICE; macro series approximate monthly averages; n = 20 months.
Slide 23 of 34
The CEO takes no pay; $866M of his own money in the stock at an average cost of $3.78
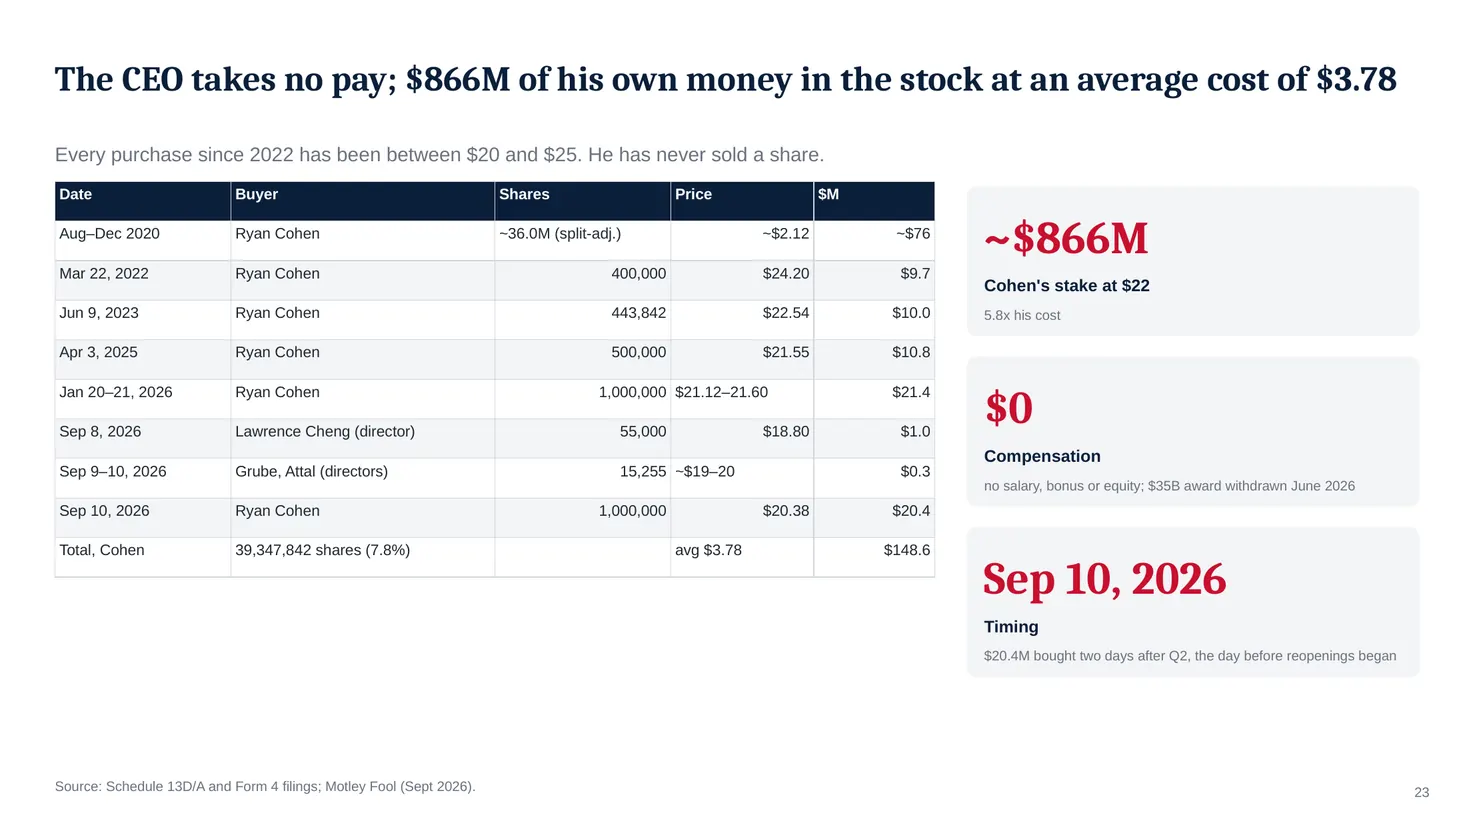
Every purchase since 2022 has been between $20 and $25. He has never sold a share.
| Date | Buyer | Shares | Price | $M |
|---|---|---|---|---|
| Aug–Dec 2020 | Ryan Cohen | ~36.0M (split-adj.) | ~$2.12 | ~$76 |
| Mar 22, 2022 | Ryan Cohen | 400,000 | $24.20 | $9.7 |
| Jun 9, 2023 | Ryan Cohen | 443,842 | $22.54 | $10.0 |
| Apr 3, 2025 | Ryan Cohen | 500,000 | $21.55 | $10.8 |
| Jan 20–21, 2026 | Ryan Cohen | 1,000,000 | $21.12–21.60 | $21.4 |
| Sep 8, 2026 | Lawrence Cheng (director) | 55,000 | $18.80 | $1.0 |
| Sep 9–10, 2026 | Grube, Attal (directors) | 15,255 | ~$19–20 | $0.3 |
| Sep 10, 2026 | Ryan Cohen | 1,000,000 | $20.38 | $20.4 |
| Total, Cohen | 39,347,842 shares (7.8%) | avg $3.78 | $148.6 |
~$866M
Cohen's stake at $22
5.8x his cost
$0
Compensation
no salary, bonus or equity; $35B award withdrawn June 2026
Sep 10, 2026
Timing
$20.4M bought two days after Q2, the day before reopenings began
Source: Schedule 13D/A and Form 4 filings; Motley Fool (Sept 2026).
Slide 24 of 34
Cohen's net worth is concentrated; GameStop is ~20% of it and the only position he adds to
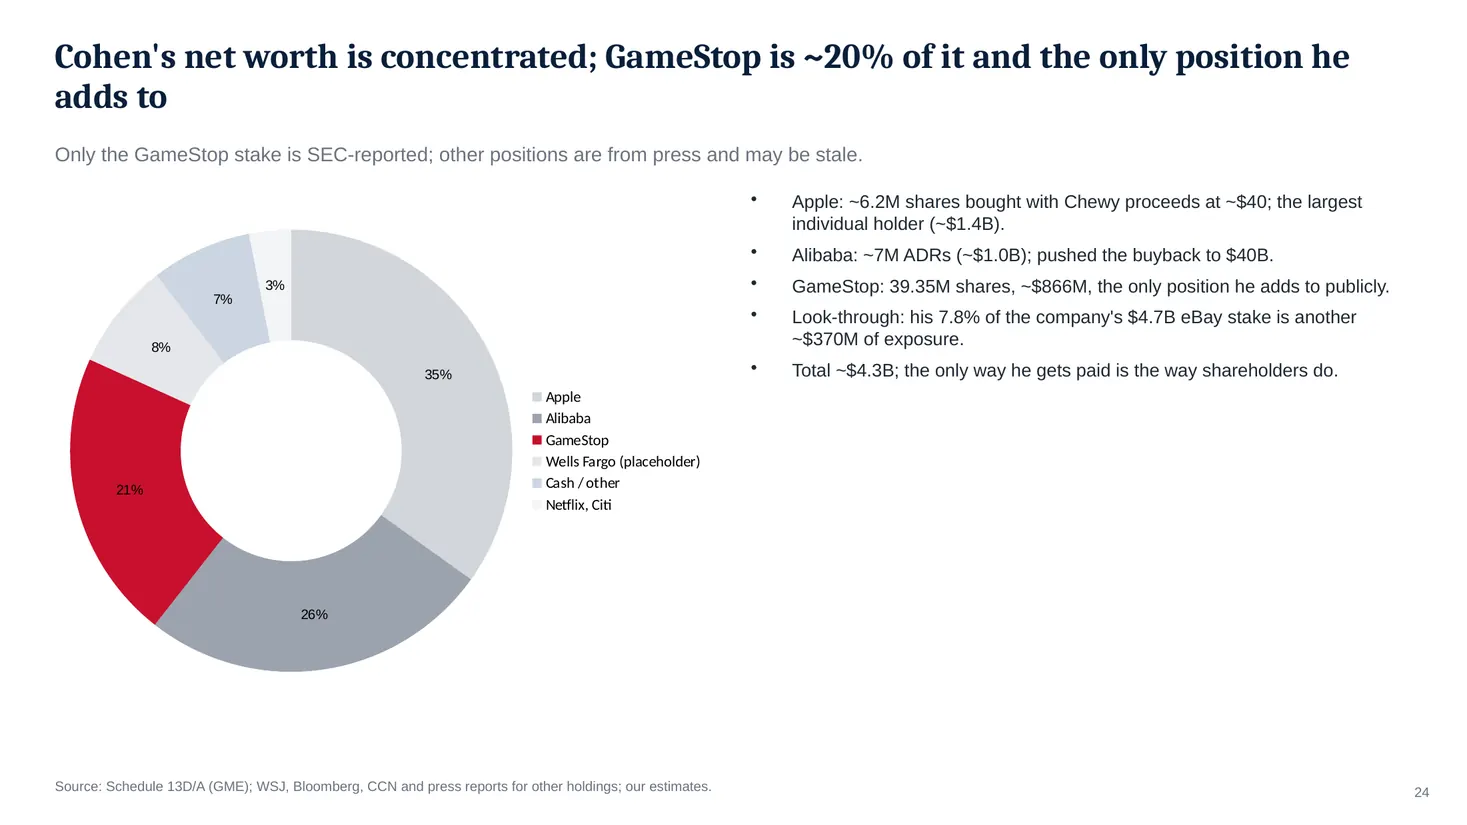
Only the GameStop stake is SEC-reported; other positions are from press and may be stale.
Chart data
| Category | Net worth |
|---|---|
| Apple | 1426.0 |
| Alibaba | 1050.0 |
| GameStop | 866.0 |
| Wells Fargo (placeholder) | 320.0 |
| Cash / other | 300.0 |
| Netflix, Citi | 125.0 |
Apple: ~6.2M shares bought with Chewy proceeds at ~$40; the largest individual holder (~$1.4B).
Alibaba: ~7M ADRs (~$1.0B); pushed the buyback to $40B.
GameStop: 39.35M shares, ~$866M, the only position he adds to publicly.
Look-through: his 7.8% of the company's $4.7B eBay stake is another ~$370M of exposure.
Total ~$4.3B; the only way he gets paid is the way shareholders do.
Source: Schedule 13D/A (GME); WSJ, Bloomberg, CCN and press reports for other holdings; our estimates.
Slide 25 of 34
Cohen took $858M of SG&A out and didn't touch the stores that earn
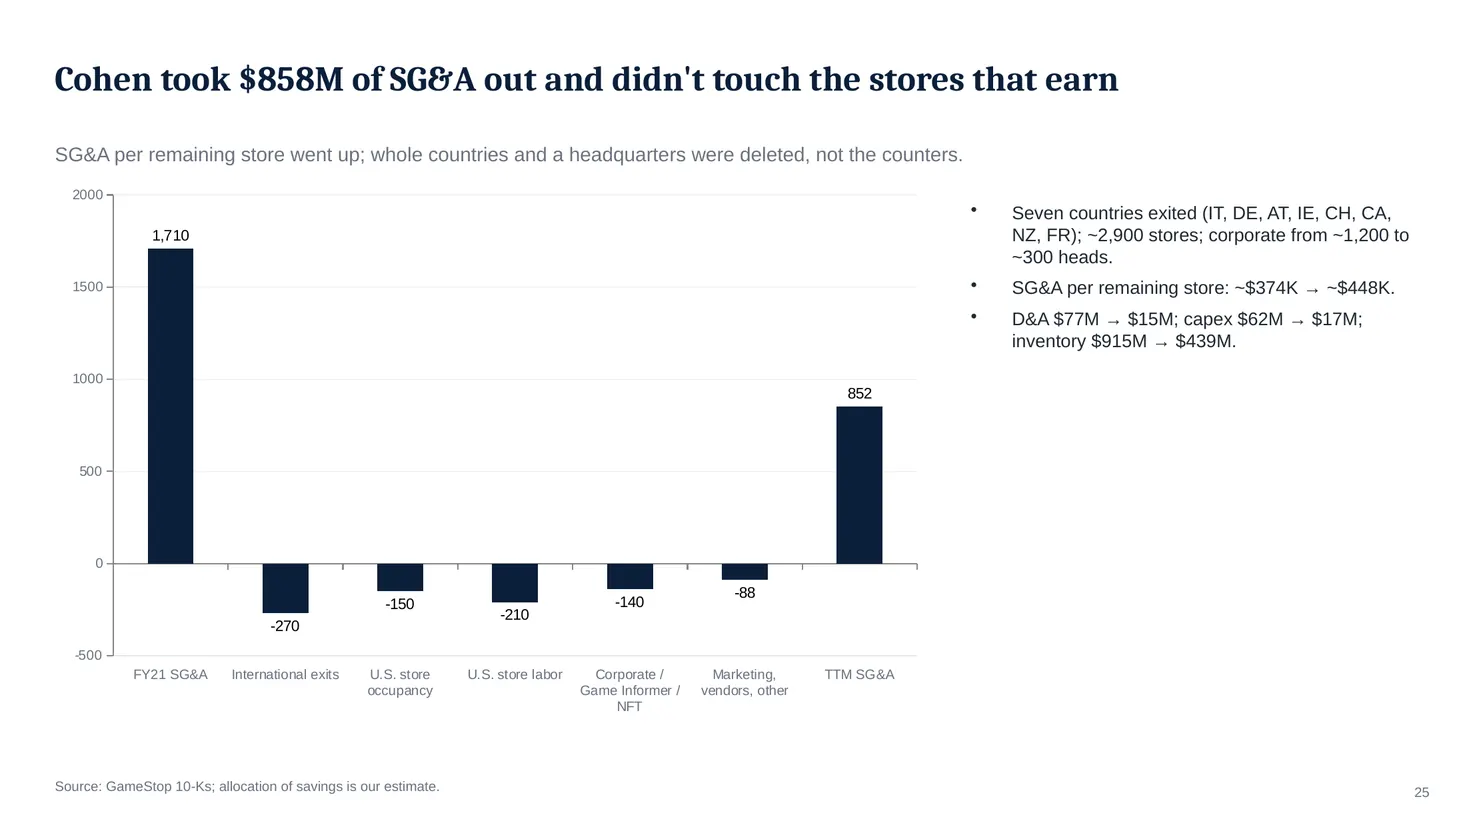
SG&A per remaining store went up; whole countries and a headquarters were deleted, not the counters.
Chart data
| Category | $M |
|---|---|
| FY21 SG&A | 1710.0 |
| International exits | -270.0 |
| U.S. store occupancy | -150.0 |
| U.S. store labor | -210.0 |
| Corporate / Game Informer / NFT | -140.0 |
| Marketing, vendors, other | -88.0 |
| TTM SG&A | 852.0 |
Seven countries exited (IT, DE, AT, IE, CH, CA, NZ, FR); ~2,900 stores; corporate from ~1,200 to ~300 heads.
SG&A per remaining store: ~$374K → ~$448K.
D&A $77M → $15M; capex $62M → $17M; inventory $915M → $439M.
Source: GameStop 10-Ks; allocation of savings is our estimate.
Slide 26 of 34
eBay: a free option; the likely outcome is a partnership worth ~$150–365M of EBITDA
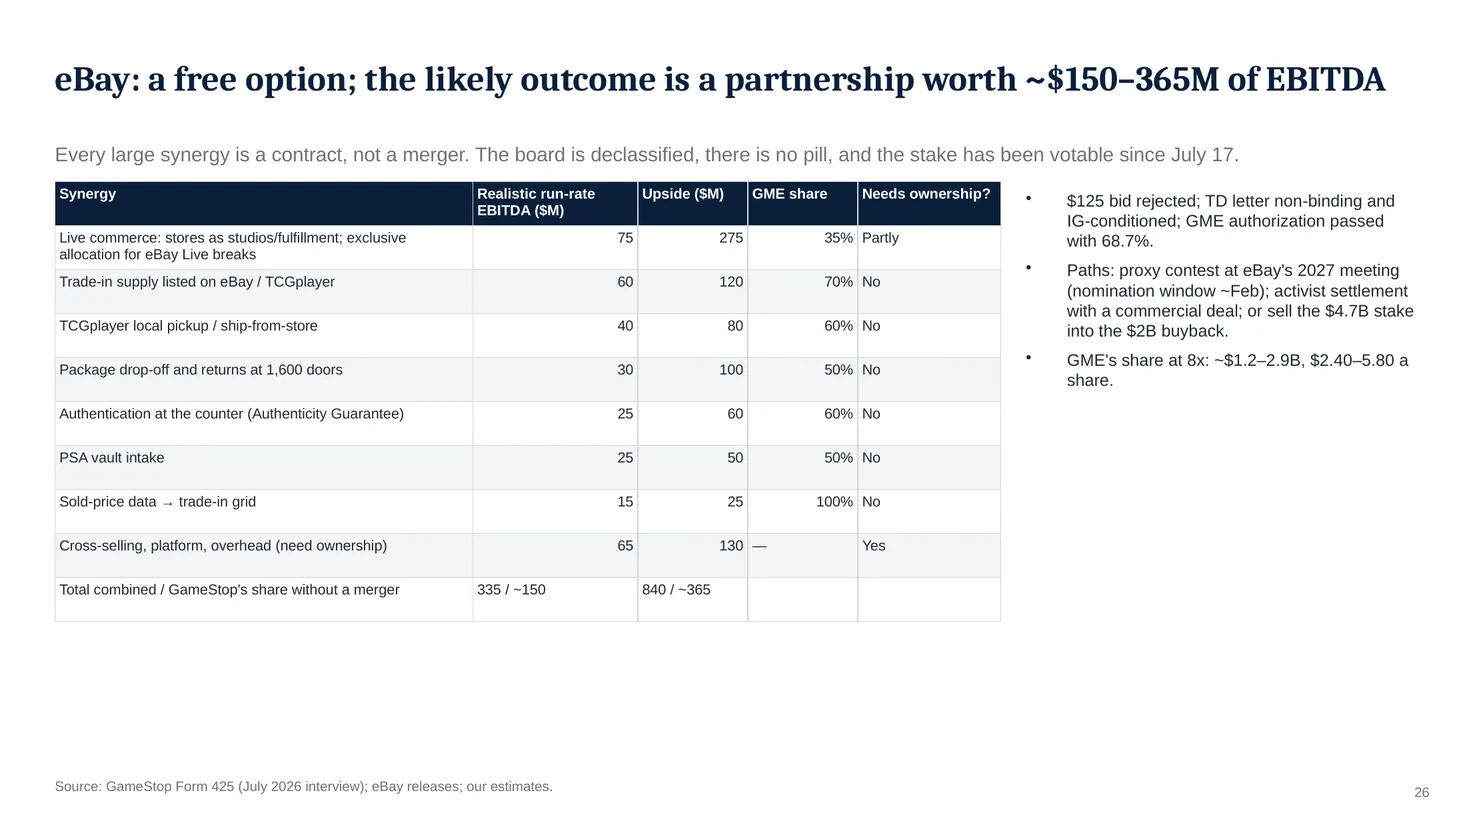
Every large synergy is a contract, not a merger. The board is declassified, there is no pill, and the stake has been votable since July 17.
| Synergy | Realistic run-rate EBITDA ($M) | Upside ($M) | GME share | Needs ownership? |
|---|---|---|---|---|
| Live commerce: stores as studios/fulfillment; exclusive allocation for eBay Live breaks | 75 | 275 | 35% | Partly |
| Trade-in supply listed on eBay / TCGplayer | 60 | 120 | 70% | No |
| TCGplayer local pickup / ship-from-store | 40 | 80 | 60% | No |
| Package drop-off and returns at 1,600 doors | 30 | 100 | 50% | No |
| Authentication at the counter (Authenticity Guarantee) | 25 | 60 | 60% | No |
| PSA vault intake | 25 | 50 | 50% | No |
| Sold-price data → trade-in grid | 15 | 25 | 100% | No |
| Cross-selling, platform, overhead (need ownership) | 65 | 130 | — | Yes |
| Total combined / GameStop's share without a merger | 335 / ~150 | 840 / ~365 |
$125 bid rejected; TD letter non-binding and IG-conditioned; GME authorization passed with 68.7%.
Paths: proxy contest at eBay's 2027 meeting (nomination window ~Feb); activist settlement with a commercial deal; or sell the $4.7B stake into the $2B buyback.
GME's share at 8x: ~$1.2–2.9B, $2.40–5.80 a share.
Source: GameStop Form 425 (July 2026 interview); eBay releases; our estimates.
Slide 27 of 34
eBay owns TCGplayer; GameStop owns a tenth of eBay
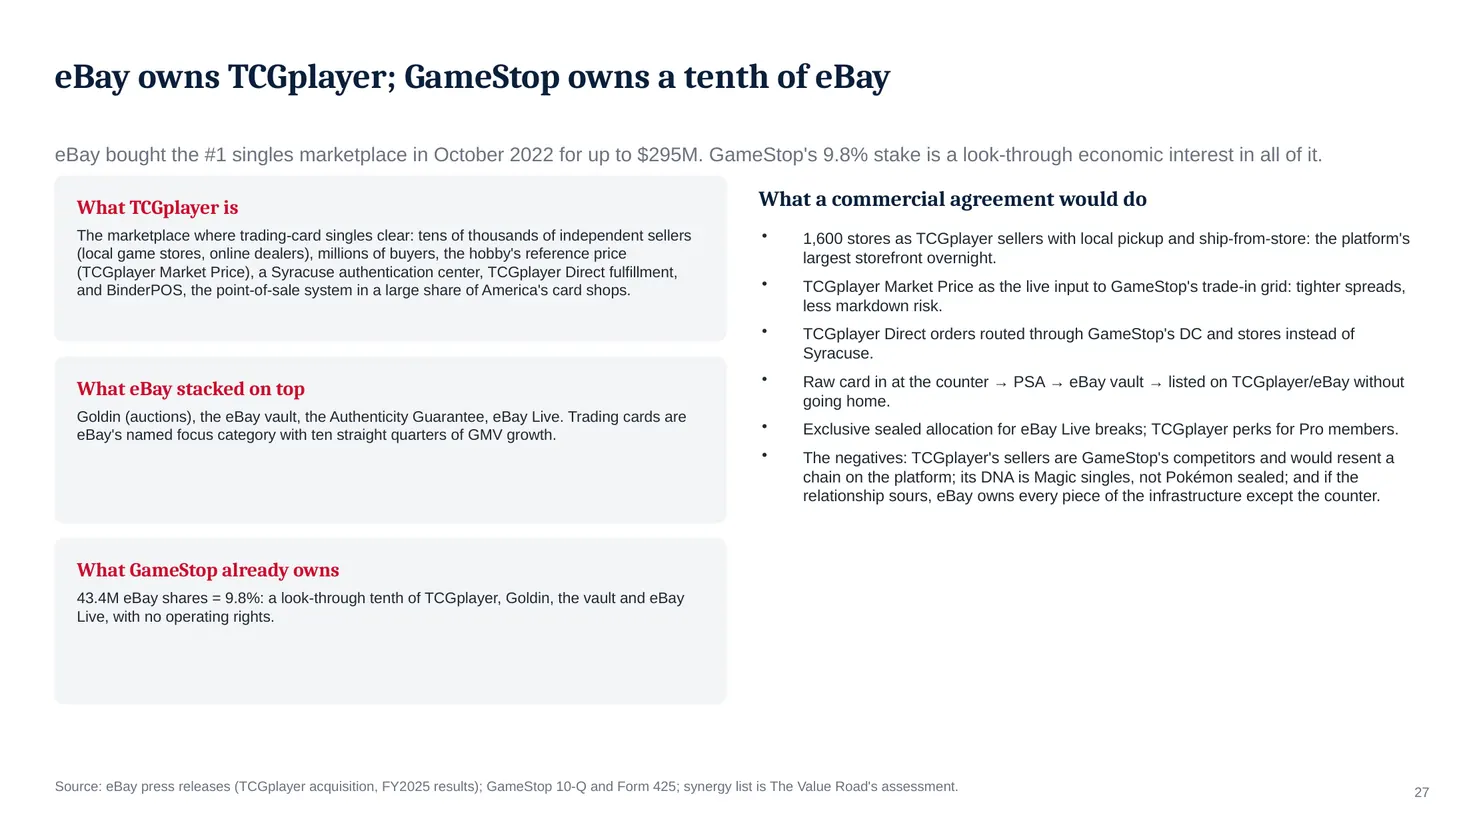
eBay bought the #1 singles marketplace in October 2022 for up to $295M. GameStop's 9.8% stake is a look-through economic interest in all of it.
What a commercial agreement would do
What TCGplayer is
The marketplace where trading-card singles clear: tens of thousands of independent sellers (local game stores, online dealers), millions of buyers, the hobby's reference price (TCGplayer Market Price), a Syracuse authentication center, TCGplayer Direct fulfillment, and BinderPOS, the point-of-sale system in a large share of America's card shops.
1,600 stores as TCGplayer sellers with local pickup and ship-from-store: the platform's largest storefront overnight.
TCGplayer Market Price as the live input to GameStop's trade-in grid: tighter spreads, less markdown risk.
TCGplayer Direct orders routed through GameStop's DC and stores instead of Syracuse.
Raw card in at the counter → PSA → eBay vault → listed on TCGplayer/eBay without going home.
Exclusive sealed allocation for eBay Live breaks; TCGplayer perks for Pro members.
The negatives: TCGplayer's sellers are GameStop's competitors and would resent a chain on the platform; its DNA is Magic singles, not Pokémon sealed; and if the relationship sours, eBay owns every piece of the infrastructure except the counter.
What eBay stacked on top
Goldin (auctions), the eBay vault, the Authenticity Guarantee, eBay Live. Trading cards are eBay's named focus category with ten straight quarters of GMV growth.
What GameStop already owns
43.4M eBay shares = 9.8%: a look-through tenth of TCGplayer, Goldin, the vault and eBay Live, with no operating rights.
Source: eBay press releases (TCGplayer acquisition, FY2025 results); GameStop 10-Q and Form 425; synergy list is The Value Road's assessment.
Slide 28 of 34
If he does get control of eBay, the prize is the Whatnot market
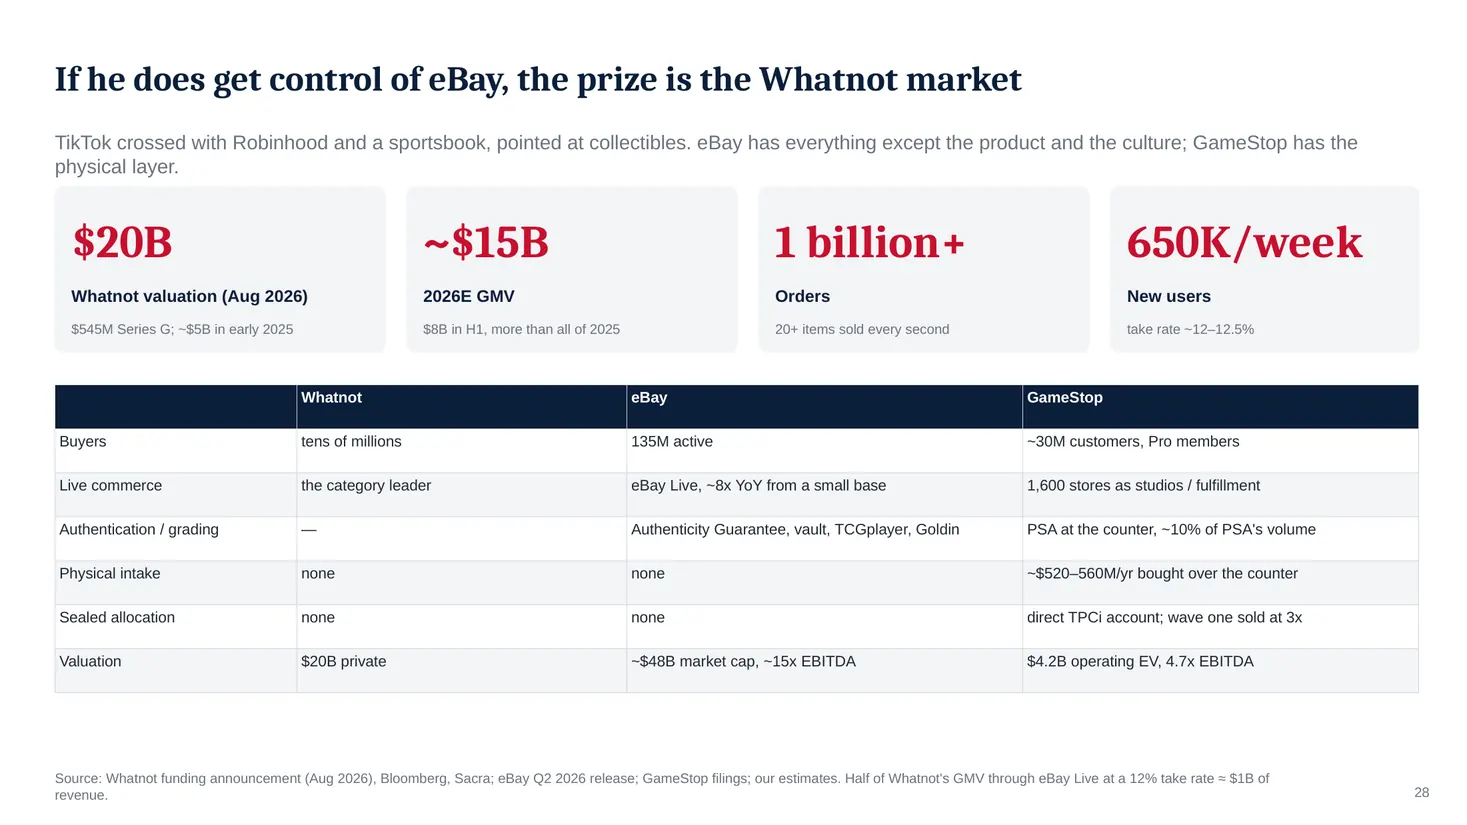
TikTok crossed with Robinhood and a sportsbook, pointed at collectibles. eBay has everything except the product and the culture; GameStop has the physical layer.
$20B
~$15B
1 billion+
650K/week
Whatnot valuation (Aug 2026)
2026E GMV
Orders
New users
$545M Series G; ~$5B in early 2025
$8B in H1, more than all of 2025
20+ items sold every second
take rate ~12–12.5%
| Whatnot | eBay | GameStop | |
|---|---|---|---|
| Buyers | tens of millions | 135M active | ~30M customers, Pro members |
| Live commerce | the category leader | eBay Live, ~8x YoY from a small base | 1,600 stores as studios / fulfillment |
| Authentication / grading | — | Authenticity Guarantee, vault, TCGplayer, Goldin | PSA at the counter, ~10% of PSA's volume |
| Physical intake | none | none | ~$520–560M/yr bought over the counter |
| Sealed allocation | none | none | direct TPCi account; wave one sold at 3x |
| Valuation | $20B private | ~$48B market cap, ~15x EBITDA | $4.2B operating EV, 4.7x EBITDA |
Source: Whatnot funding announcement (Aug 2026), Bloomberg, Sacra; eBay Q2 2026 release; GameStop filings; our estimates. Half of Whatnot's GMV through eBay Live at a 12% take rate ≈ $1B of revenue.
Slide 29 of 34
Comps: priced below Japanese secondhand chains that earn a third of the margin
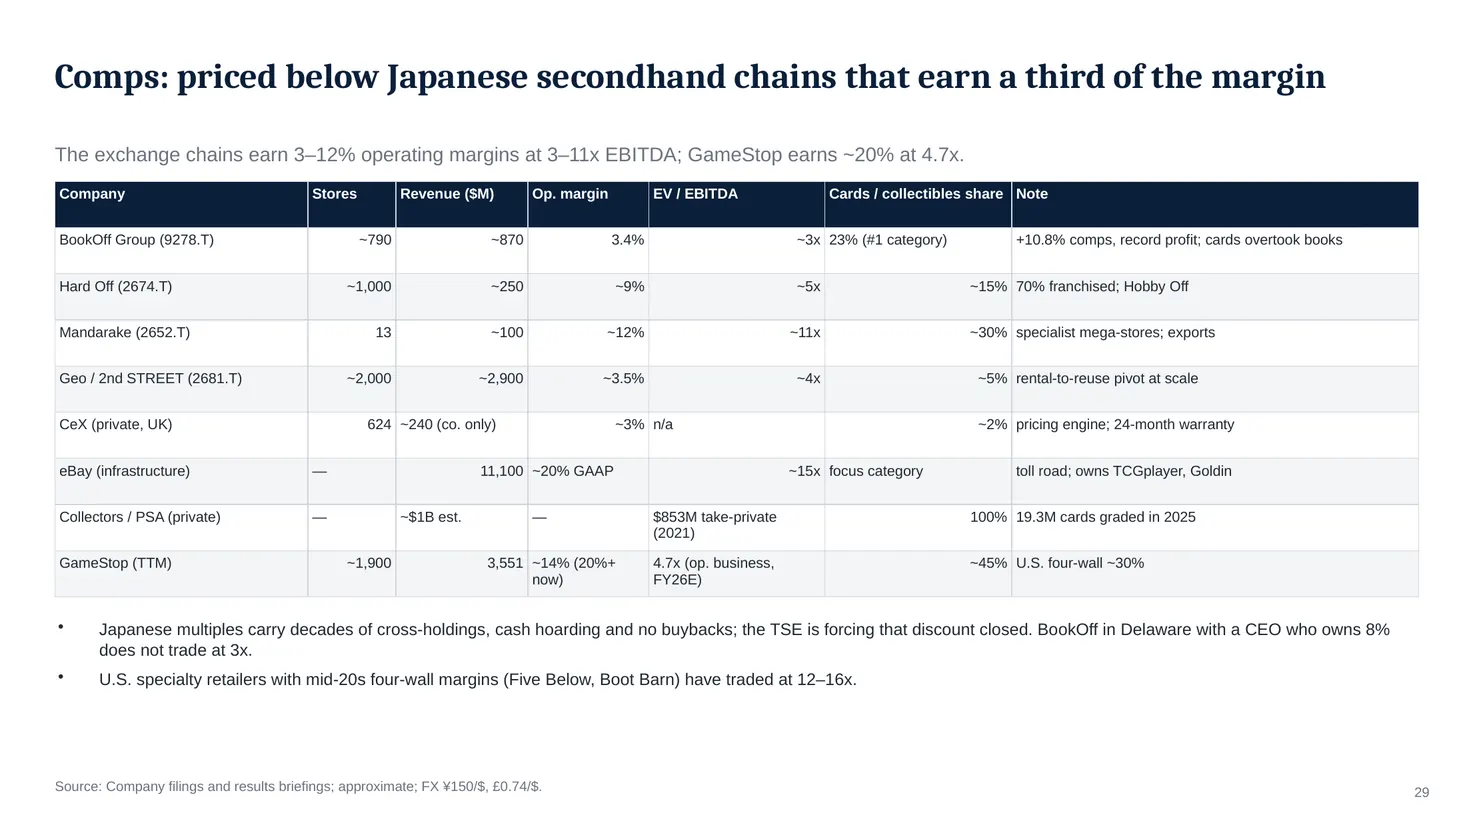
The exchange chains earn 3–12% operating margins at 3–11x EBITDA; GameStop earns ~20% at 4.7x.
| Company | Stores | Revenue ($M) | Op. margin | EV / EBITDA | Cards / collectibles share | Note |
|---|---|---|---|---|---|---|
| BookOff Group (9278.T) | ~790 | ~870 | 3.4% | ~3x | 23% (#1 category) | +10.8% comps, record profit; cards overtook books |
| Hard Off (2674.T) | ~1,000 | ~250 | ~9% | ~5x | ~15% | 70% franchised; Hobby Off |
| Mandarake (2652.T) | 13 | ~100 | ~12% | ~11x | ~30% | specialist mega-stores; exports |
| Geo / 2nd STREET (2681.T) | ~2,000 | ~2,900 | ~3.5% | ~4x | ~5% | rental-to-reuse pivot at scale |
| CeX (private, UK) | 624 | ~240 (co. only) | ~3% | n/a | ~2% | pricing engine; 24-month warranty |
| eBay (infrastructure) | — | 11,100 | ~20% GAAP | ~15x | focus category | toll road; owns TCGplayer, Goldin |
| Collectors / PSA (private) | — | ~$1B est. | — | $853M take-private (2021) | 100% | 19.3M cards graded in 2025 |
| GameStop (TTM) | ~1,900 | 3,551 | ~14% (20%+ now) | 4.7x (op. business, FY26E) | ~45% | U.S. four-wall ~30% |
Japanese multiples carry decades of cross-holdings, cash hoarding and no buybacks; the TSE is forcing that discount closed. BookOff in Delaware with a CEO who owns 8% does not trade at 3x.
U.S. specialty retailers with mid-20s four-wall margins (Five Below, Boot Barn) have traded at 12–16x.
Source: Company filings and results briefings; approximate; FX ¥150/$, £0.74/$.
Slide 30 of 34
Forecast: FY26 is the step-change year; we deliberately build a slowdown into FY27
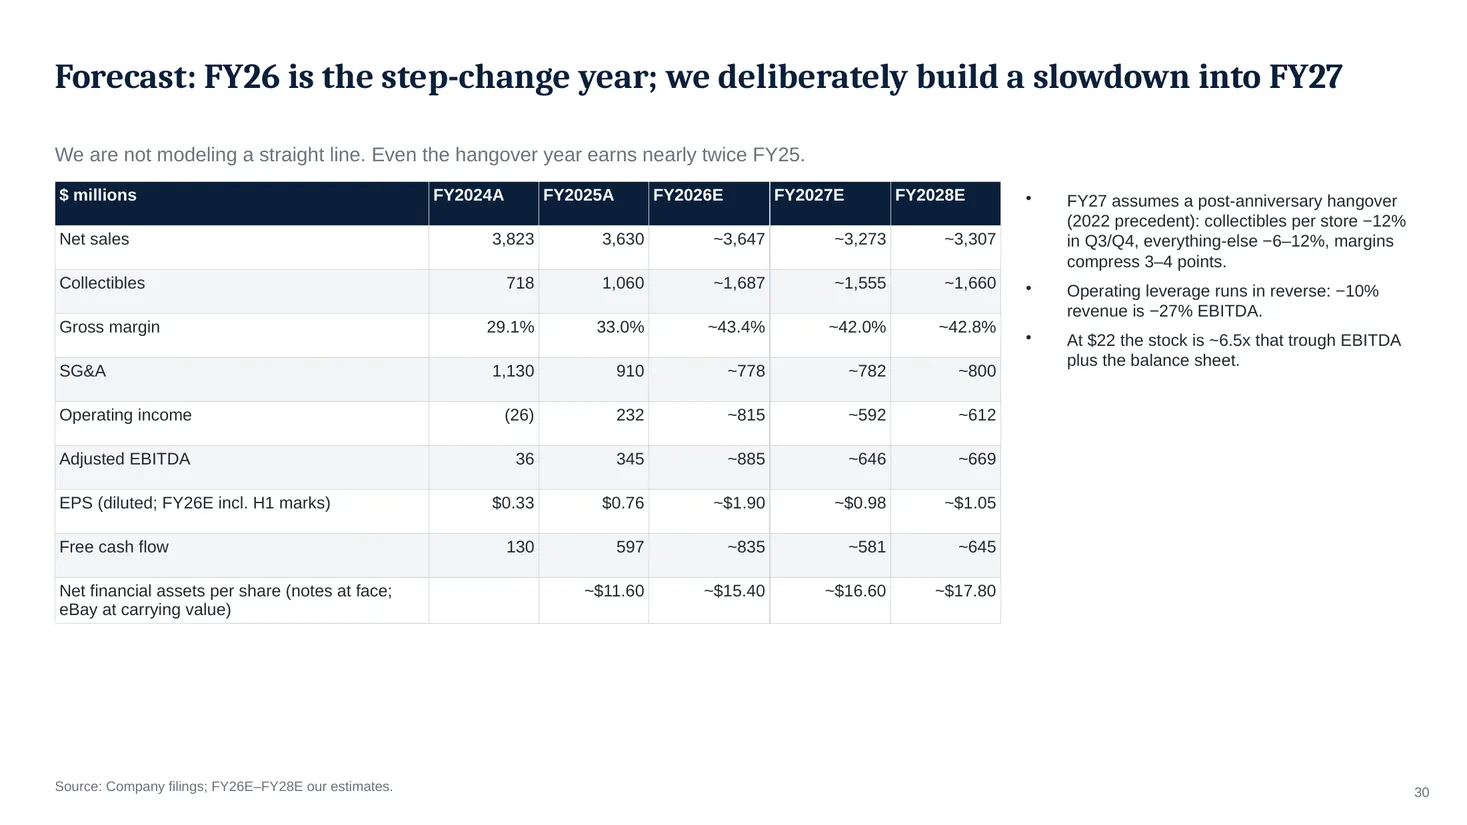
We are not modeling a straight line. Even the hangover year earns nearly twice FY25.
| $ millions | FY2024A | FY2025A | FY2026E | FY2027E | FY2028E |
|---|---|---|---|---|---|
| Net sales | 3,823 | 3,630 | ~3,647 | ~3,273 | ~3,307 |
| Collectibles | 718 | 1,060 | ~1,687 | ~1,555 | ~1,660 |
| Gross margin | 29.1% | 33.0% | ~43.4% | ~42.0% | ~42.8% |
| SG&A | 1,130 | 910 | ~778 | ~782 | ~800 |
| Operating income | (26) | 232 | ~815 | ~592 | ~612 |
| Adjusted EBITDA | 36 | 345 | ~885 | ~646 | ~669 |
| EPS (diluted; FY26E incl. H1 marks) | $0.33 | $0.76 | ~$1.90 | ~$0.98 | ~$1.05 |
| Free cash flow | 130 | 597 | ~835 | ~581 | ~645 |
| Net financial assets per share (notes at face; eBay at carrying value) | ~$11.60 | ~$15.40 | ~$16.60 | ~$17.80 |
FY27 assumes a post-anniversary hangover (2022 precedent): collectibles per store −12% in Q3/Q4, everything-else −6–12%, margins compress 3–4 points.
Operating leverage runs in reverse: −10% revenue is −27% EBITDA.
At $22 the stock is ~6.5x that trough EBITDA plus the balance sheet.
Source: Company filings; FY26E–FY28E our estimates.
Slide 31 of 34
Every catalyst has a date
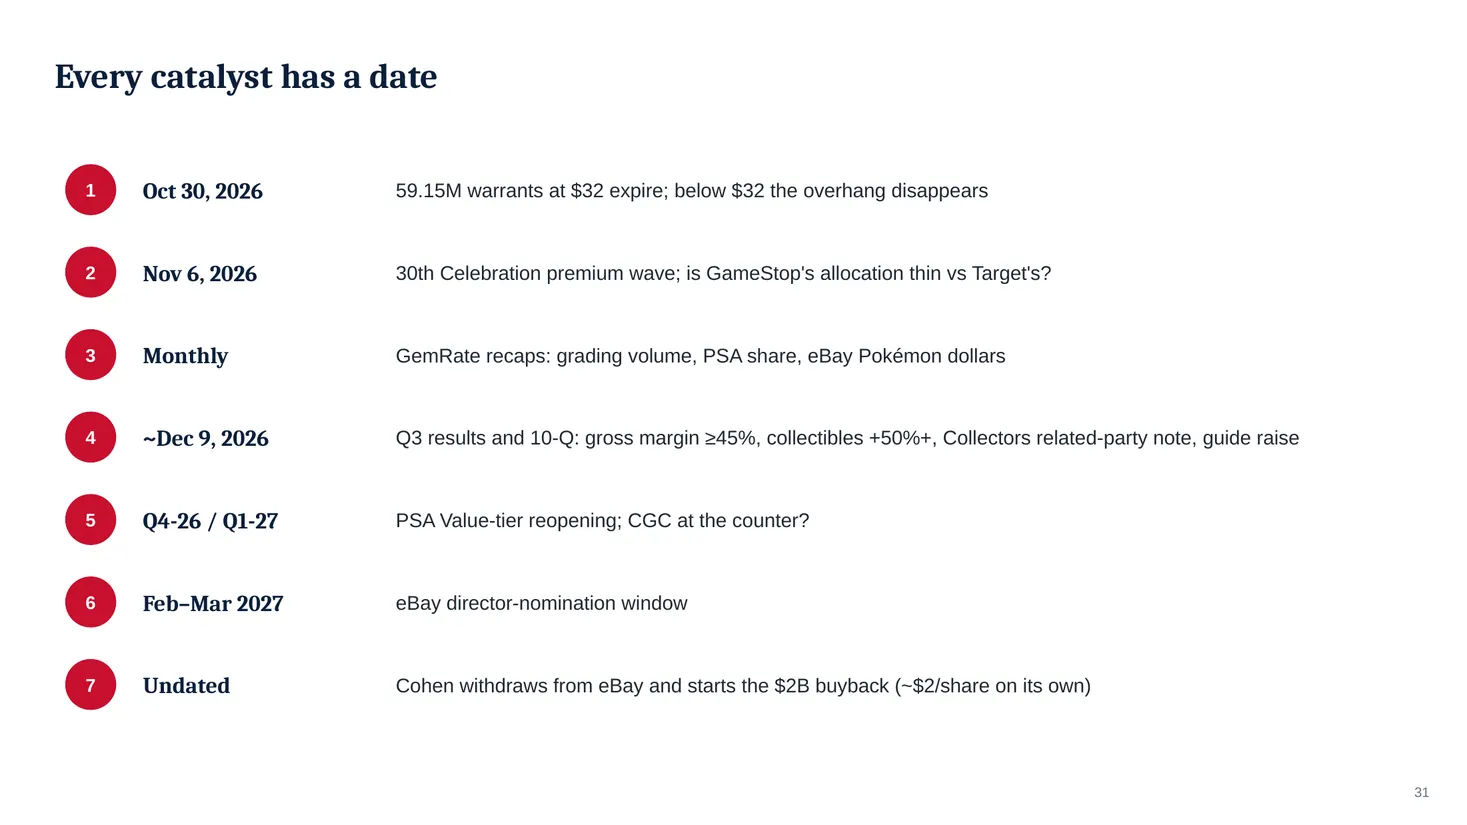
Oct 30, 2026
59.15M warrants at $32 expire; below $32 the overhang disappears
Nov 6, 2026
30th Celebration premium wave; is GameStop's allocation thin vs Target's?
Monthly
GemRate recaps: grading volume, PSA share, eBay Pokémon dollars
~Dec 9, 2026
Q3 results and 10-Q: gross margin ≥45%, collectibles +50%+, Collectors related-party note, guide raise
Q4-26 / Q1-27
PSA Value-tier reopening; CGC at the counter?
Feb–Mar 2027
eBay director-nomination window
Undated
Cohen withdraws from eBay and starts the $2B buyback (~$2/share on its own)
Slide 32 of 34
Risks (1): the cycle, the licensor, and the deal
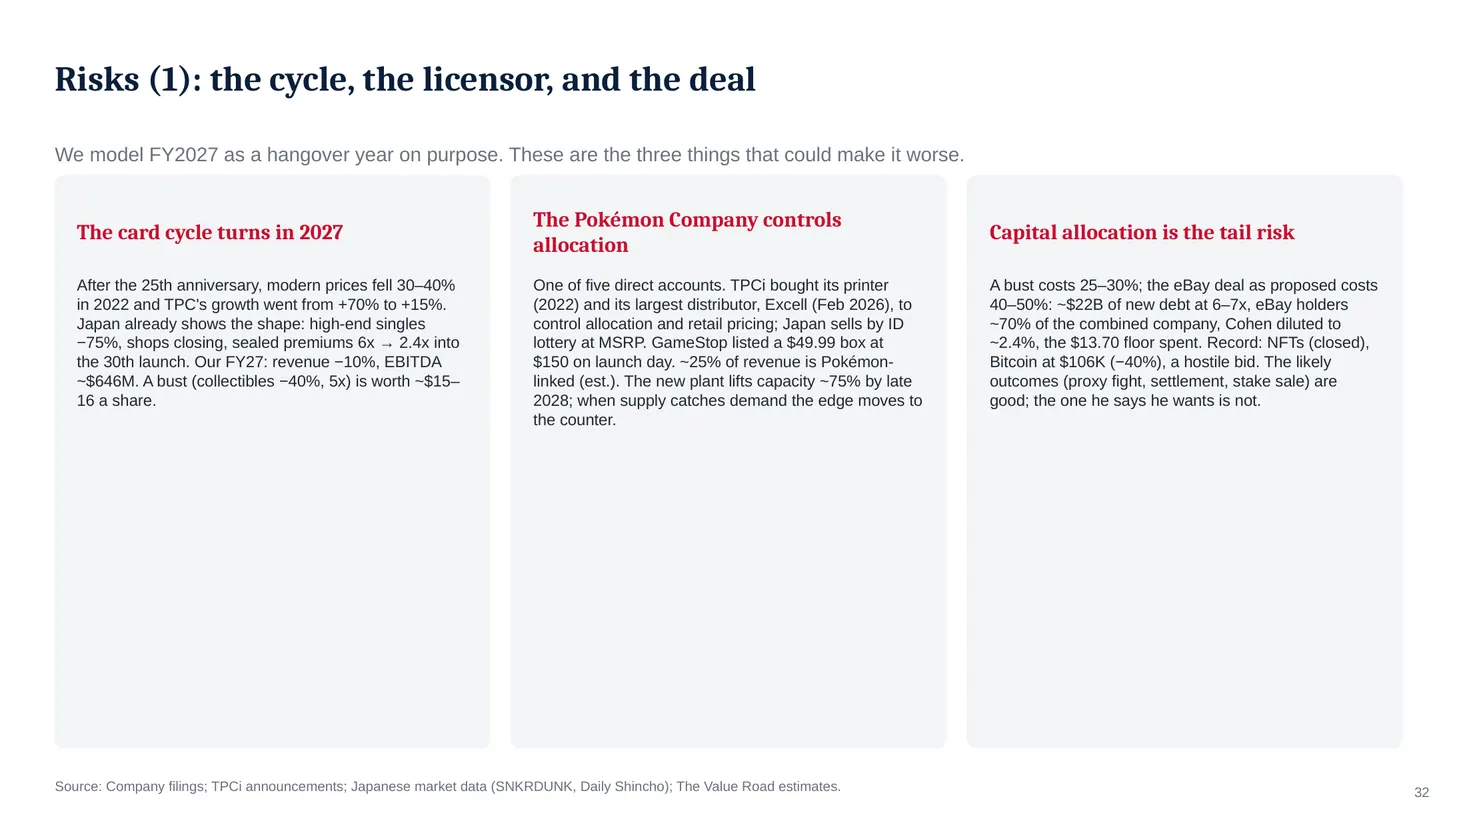
We model FY2027 as a hangover year on purpose. These are the three things that could make it worse.
The card cycle turns in 2027
The Pokémon Company controls allocation
Capital allocation is the tail risk
After the 25th anniversary, modern prices fell 30–40% in 2022 and TPC's growth went from +70% to +15%. Japan already shows the shape: high-end singles −75%, shops closing, sealed premiums 6x → 2.4x into the 30th launch. Our FY27: revenue −10%, EBITDA ~$646M. A bust (collectibles −40%, 5x) is worth ~$15–16 a share.
One of five direct accounts. TPCi bought its printer (2022) and its largest distributor, Excell (Feb 2026), to control allocation and retail pricing; Japan sells by ID lottery at MSRP. GameStop listed a $49.99 box at $150 on launch day. ~25% of revenue is Pokémon-linked (est.). The new plant lifts capacity ~75% by late 2028; when supply catches demand the edge moves to the counter.
A bust costs 25–30%; the eBay deal as proposed costs 40–50%: ~$22B of new debt at 6–7x, eBay holders ~70% of the combined company, Cohen diluted to ~2.4%, the $13.70 floor spent. Record: NFTs (closed), Bitcoin at $106K (−40%), a hostile bid. The likely outcomes (proxy fight, settlement, stake sale) are good; the one he says he wants is not.
Source: Company filings; TPCi announcements; Japanese market data (SNKRDUNK, Daily Shincho); The Value Road estimates.
Slide 33 of 34
Risks (2): the funnel, the marketplace, the macro, and the numbers you can't check
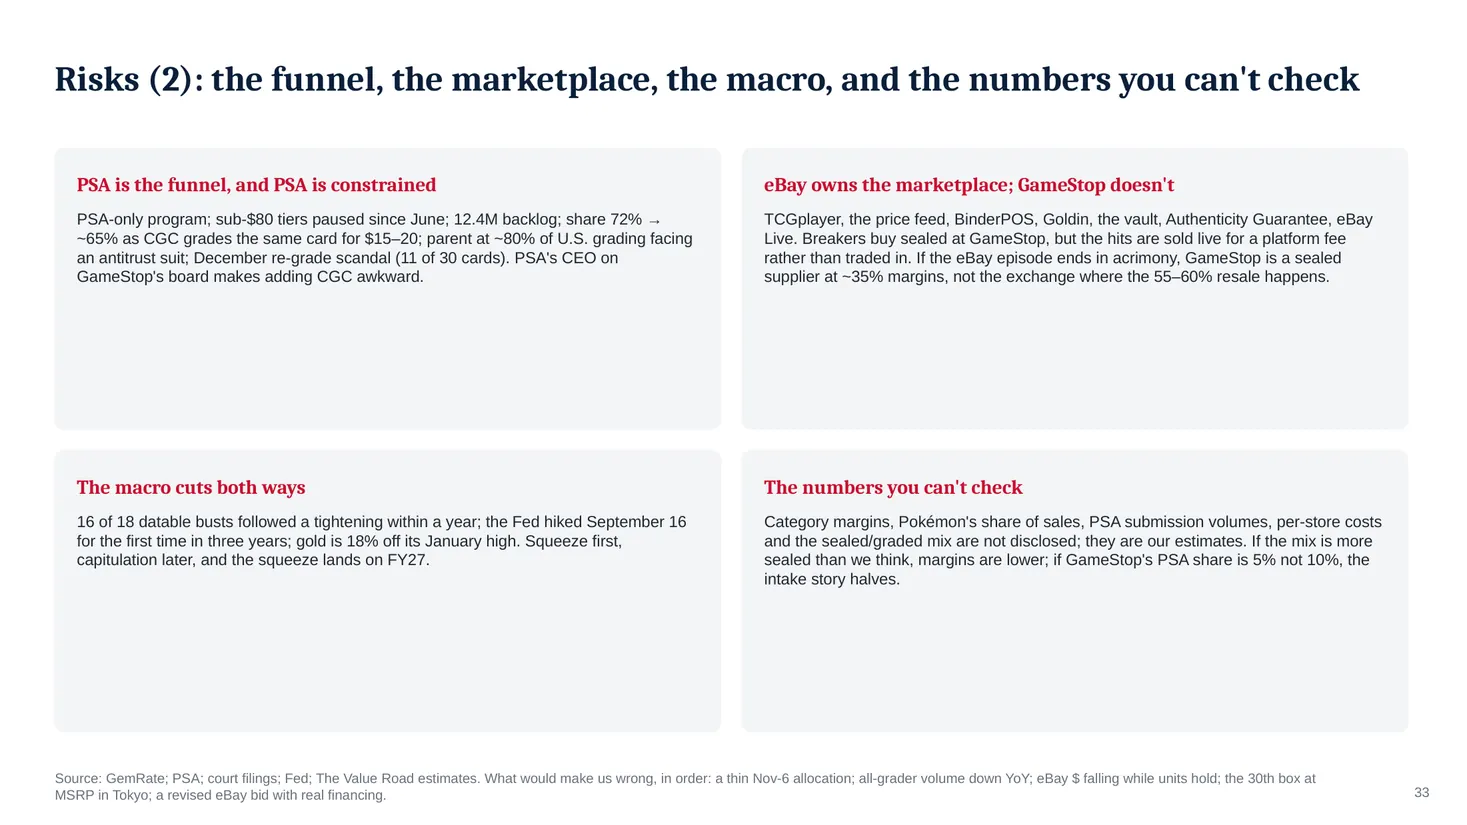
PSA is the funnel, and PSA is constrained
eBay owns the marketplace; GameStop doesn't
PSA-only program; sub-$80 tiers paused since June; 12.4M backlog; share 72% → ~65% as CGC grades the same card for $15–20; parent at ~80% of U.S. grading facing an antitrust suit; December re-grade scandal (11 of 30 cards). PSA's CEO on GameStop's board makes adding CGC awkward.
TCGplayer, the price feed, BinderPOS, Goldin, the vault, Authenticity Guarantee, eBay Live. Breakers buy sealed at GameStop, but the hits are sold live for a platform fee rather than traded in. If the eBay episode ends in acrimony, GameStop is a sealed supplier at ~35% margins, not the exchange where the 55–60% resale happens.
The macro cuts both ways
The numbers you can't check
16 of 18 datable busts followed a tightening within a year; the Fed hiked September 16 for the first time in three years; gold is 18% off its January high. Squeeze first, capitulation later, and the squeeze lands on FY27.
Category margins, Pokémon's share of sales, PSA submission volumes, per-store costs and the sealed/graded mix are not disclosed; they are our estimates. If the mix is more sealed than we think, margins are lower; if GameStop's PSA share is 5% not 10%, the intake story halves.
Source: GemRate; PSA; court filings; Fed; The Value Road estimates. What would make us wrong, in order: a thin Nov-6 allocation; all-grader volume down YoY; eBay $ falling while units hold; the 30th box at MSRP in Tokyo; a revised eBay bid with real financing.
Slide 34 of 34
The one-line version
$13.70 of cash and stock, a card shop earning 30% four-wall margins at 4.7x EBITDA and a 20% free cash flow yield that no fund will put on a 13F, the largest physical intake network in the fastest-growing collectible category in the world, run by a man who paid $3.78 and keeps buying at $20, walking into an anniversary quarter with a guide he is about to beat by $200M.
Someone will eventually have to explain how they missed a company that turned Pokémon cards into $850M of EBITDA and a 20% cash yield.